Introduction
A 45% drop in Netflix recommendation relevance represents a critical issue that directly impacts user satisfaction, engagement, and ultimately retention. Recommendation systems are core to Netflix's value proposition, helping users discover content they'll enjoy from a vast library. This significant degradation requires systematic investigation to identify root causes and implement effective solutions.
I'll approach this analysis by first clarifying the exact nature of the problem, then systematically exploring potential causes from technical, product, and user behavior perspectives before developing a comprehensive resolution plan.
This analysis follows a structured approach covering issue identification, hypothesis generation, validation, and solution development.
Step 1
Clarifying Questions (3 minutes)
Why it matters: Understanding the metric composition helps identify which components might be failing. Expected answer: It's likely a composite metric including watch time, completion rates, and user ratings of recommended content. Impact on approach: Different components would point to different potential failure points in the recommendation system.
Why it matters: The pattern and timing could indicate whether this correlates with a specific product change, algorithm update, or external event. Expected answer: The drop occurred within the last 2-4 weeks and was relatively sudden. Impact on approach: A sudden drop would suggest a specific trigger event rather than gradual user behavior shifts.
Why it matters: Segmented impact could point to issues affecting specific user groups or content categories. Expected answer: The drop is more pronounced among certain user segments or regions. Impact on approach: Segment-specific issues would narrow our investigation to particular user cohorts or content libraries.
Why it matters: Recent changes are often the most likely culprits for sudden performance degradations. Expected answer: Several changes were deployed, including algorithm updates and infrastructure modifications. Impact on approach: This would help prioritize investigation of specific changes that correlate with the timing of the drop.
Why it matters: Sometimes apparent performance issues are actually measurement anomalies. Expected answer: No changes to measurement methodology, but possibly some data pipeline modifications. Impact on approach: Would help determine if we're dealing with an actual performance issue or a measurement problem.
Step 2
Rule Out Basic External Factors (3 minutes)
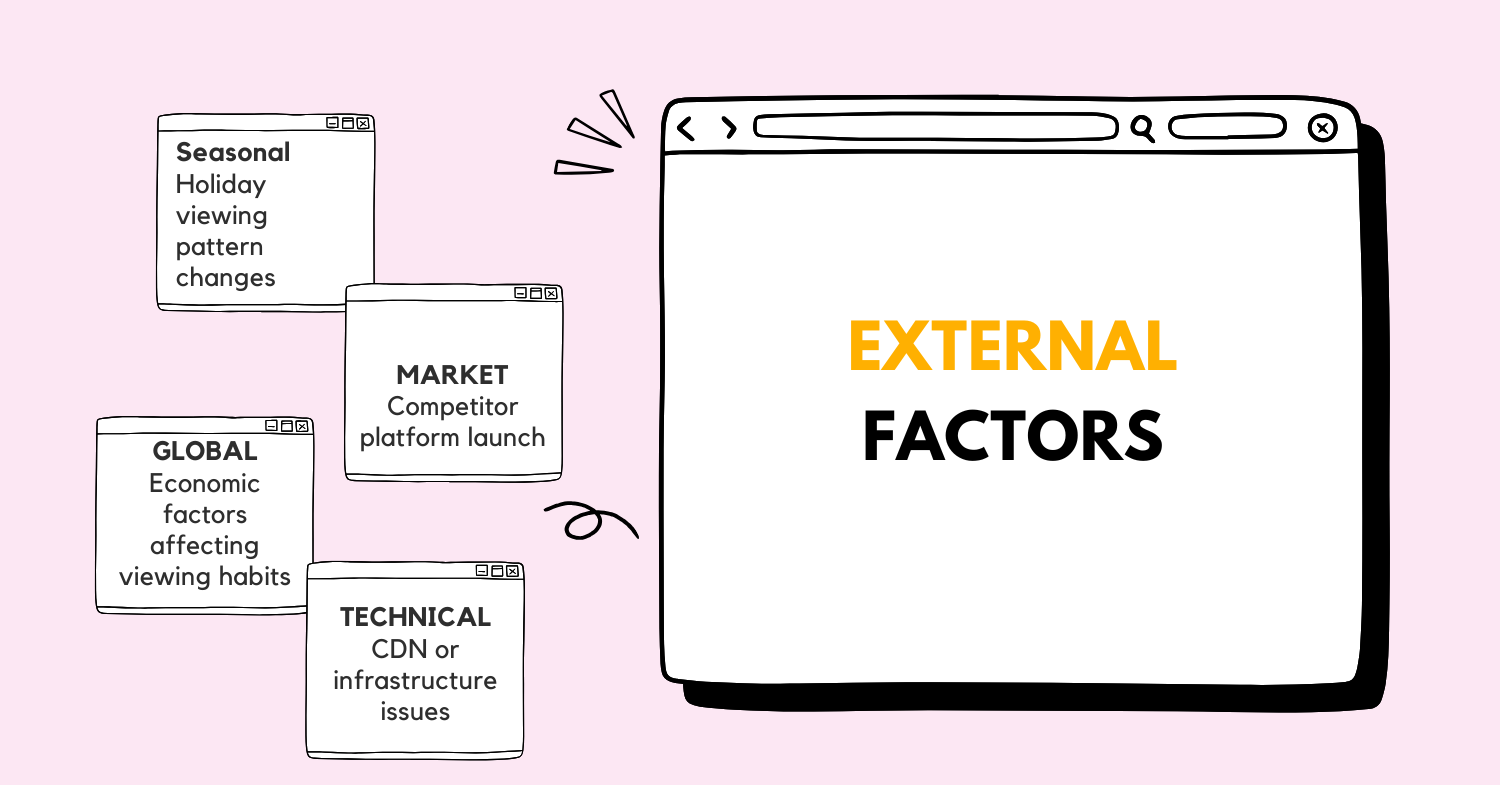 Before diving deeper, let's quickly assess potential external factors that could explain this significant drop:
| Category | Factors | Impact Assessment | Status |
|---|---|---|---|
| Natural | Seasonal viewing pattern changes | Low - Netflix typically accounts for seasonality in their algorithms | Rule out |
| Market | Major competitor launches (Disney+, HBO Max expansions) | Medium - Could affect content availability and viewing patterns | Consider |
| Global | Economic factors affecting viewing habits | Low - Usually gradual impact, not sudden 45% drops | Rule out |
| Technical | CDN or infrastructure issues affecting recommendation delivery | High - Could directly impact recommendation quality | Consider |
| Content | Major content library changes (loss of popular titles) | High - Could affect recommendation quality if algorithm hasn't adapted | Consider |
While external factors like competitor moves or content library changes could contribute to the issue, a 45% drop is too dramatic to be explained solely by these factors. Netflix's recommendation systems are designed to be resilient to gradual market shifts. This suggests we need to look more deeply at internal technical or product factors.
Step 3
Product Understanding and User Journey (3 minutes)
Netflix's recommendation system is fundamental to the user experience, helping subscribers discover relevant content from a vast library. The system uses collaborative filtering, content-based filtering, and increasingly, deep learning approaches to suggest titles users are likely to enjoy.
A typical user journey involving recommendations includes:
- User logs into Netflix account
- System generates personalized recommendations based on:
- Watch history
- Explicit ratings
- Similar users' preferences
- Content attributes
- Trending/popular content
- Recommendations are displayed in various rows on the homepage
- User browses recommendations, potentially clicking on titles for more information
- User selects content to watch
- Post-viewing, user engagement data feeds back into the recommendation algorithm
The recommendation relevance metric likely measures how effectively this journey leads to content consumption and satisfaction. A 45% drop suggests a fundamental breakdown in this process - either the recommendations being generated are less relevant, or users are finding them less compelling for some reason.
Edge cases to consider include new users with limited viewing history, users who share accounts across different taste profiles, and international users where content libraries and cultural preferences vary significantly.
Step 4
Metric Breakdown (3 minutes)
Let's break down the "recommendation relevance" metric to understand its components:
This metric likely combines:
- Engagement metrics: How often users click on recommended titles
- Consumption metrics: How much of the recommended content users actually watch
- Satisfaction metrics: How users rate content they discovered through recommendations
- Retention metrics: Whether users continue watching series or similar content
A 45% drop could manifest in several ways:
- Users clicking on fewer recommendations
- Users abandoning recommended content more quickly
- Users giving lower ratings to recommended content
- Users not continuing series they started based on recommendations
Understanding which components are most affected would help narrow down the root cause. For example, if users are clicking but not watching, that suggests content mismatch issues. If they're not clicking at all, that could indicate UI problems or poor recommendation quality.
Step 5
Data Gathering and Prioritization (3 minutes)
To investigate this issue thoroughly, I would request the following data:
| Data Type | Purpose | Priority | Source |
|---|---|---|---|
| Recommendation Algorithm Logs | Identify changes in algorithm outputs | High | ML Platform |
| A/B Test Results | Check if any recent tests correlate with the drop | High | Experimentation Platform |
| User Engagement Metrics | Track changes in user interaction with recommendations | High | Analytics Dashboard |
| Content Catalog Changes | Identify significant library changes | Medium | Content Management System |
| Error Logs | Detect technical issues in recommendation delivery | High | Monitoring Systems |
| User Feedback | Gather qualitative insights on recommendation quality | Medium | Customer Support/Surveys |
| Infrastructure Performance | Check for backend issues affecting recommendations | Medium | DevOps Monitoring |
| Regional Performance Data | Identify if the issue is global or localized | Medium | Analytics Dashboard |
I would prioritize algorithm logs and A/B test results because they're most likely to reveal direct causes of such a significant drop. User engagement metrics would help validate the impact and pinpoint exactly where in the user journey the breakdown occurs.
For validation, I'd cross-reference data from multiple systems to ensure consistency and rule out measurement errors. I'd also segment the data by user cohorts, device types, and regions to identify patterns that might reveal more specific issues.
Step 6
Hypothesis Formation (6 minutes)
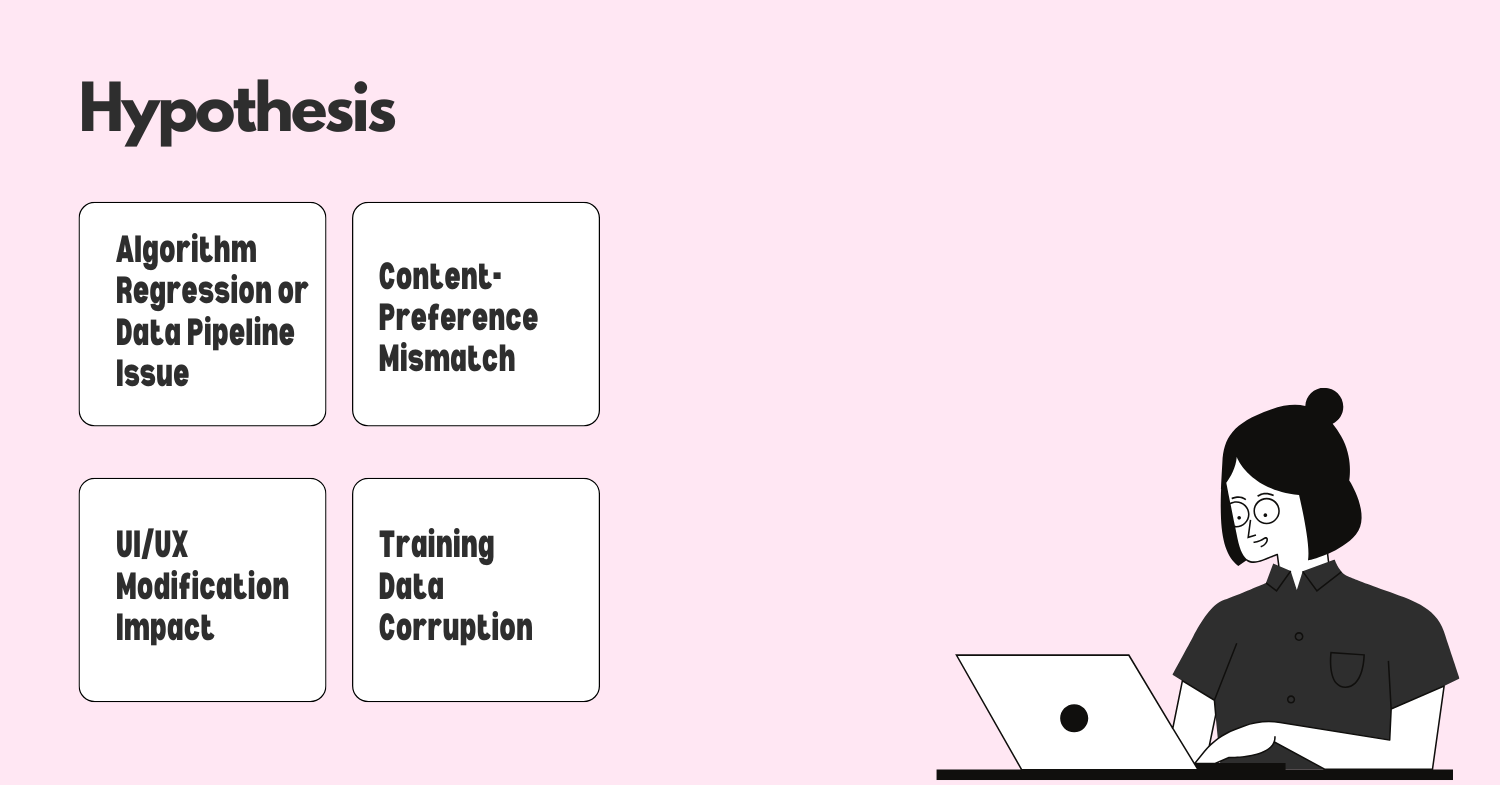 Based on the information gathered, here are my primary hypotheses:
1. Technical Hypothesis: Algorithm Regression or Data Pipeline Issue
A recent algorithm update or data pipeline failure has compromised the quality of recommendations.
Evidence points:
- Sudden rather than gradual drop suggests a technical change
- 45% magnitude indicates a fundamental system issue rather than minor degradation
- Likely correlation with a recent deployment or data processing change
Impact assessment:
- High severity - directly affects core user experience
- Potentially affecting all users or specific segments depending on the nature of the regression
Validation approach:
- Review recent algorithm deployments and rollbacks
- Check data pipeline integrity and input quality
- Compare recommendation outputs before and after the drop
- Analyze feature importance shifts in the model
2. User Behavior Hypothesis: Content-Preference Mismatch
The recommendation system hasn't adapted to a significant shift in user preferences or content availability.
Evidence points:
- Users may be seeking different types of content than what the system is recommending
- Content library changes might have created a mismatch between available content and user preferences
- Seasonal factors might be influencing viewing preferences that the system isn't accounting for
Impact assessment:
- Medium to high severity - affects user satisfaction and engagement
- Potentially more pronounced in specific user segments or content categories
Validation approach:
- Analyze changes in content consumption patterns
- Compare recommendation acceptance rates across different content categories
- Review user search behavior vs. recommendation clicks
- Segment analysis by user tenure and viewing history
3. Product Change Hypothesis: UI/UX Modification Impact
Recent changes to how recommendations are displayed or interacted with have reduced their effectiveness.
Evidence points:
- Changes in recommendation placement, visibility, or context could affect engagement
- New features might be competing for user attention
- Modified recommendation explanations might be less compelling
Impact assessment:
- Medium severity - could be addressed with UI optimizations
- Likely affecting specific parts of the user journey
Validation approach:
- Review recent UI/UX changes and their timing relative to the metric drop
- Analyze user interaction patterns with the recommendation interface
- Compare performance across different device types and app versions
- Conduct user testing to identify friction points
4. Data Quality Hypothesis: Training Data Corruption or Bias
The recommendation system is training on corrupted, outdated, or biased data, leading to poor quality recommendations.
Evidence points:
- Machine learning systems are highly dependent on training data quality
- Data drift could occur if user behaviors changed but training data didn't adapt
- Feedback loops might be reinforcing poor recommendations
Impact assessment:
- High severity - fundamental issue affecting recommendation quality
- Potentially systemic across the platform
Validation approach:
- Audit training data sources and preprocessing steps
- Check for anomalies in user feedback incorporation
- Analyze feature distribution shifts in model inputs
- Test with refreshed or alternative training datasets
Based on the sudden and significant drop, I would prioritize the Technical Hypothesis and Data Quality Hypothesis as most likely explanations, while keeping the other hypotheses as important secondary considerations.
Step 7
Root Cause Analysis (5 minutes)
Applying the "5 Whys" technique to our primary hypotheses:
Technical Hypothesis: Algorithm Regression
-
Why did recommendation relevance drop by 45%?
- Because the recommendations being served are less relevant to users' interests.
-
Why are recommendations less relevant?
- Because the algorithm is producing lower quality recommendation outputs.
-
Why is the algorithm producing lower quality outputs?
- Because either the algorithm logic changed or the inputs to the algorithm changed.
-
Why did the algorithm logic or inputs change?
- Because there was likely a recent deployment that modified the recommendation system.
-
Why did this deployment cause such a significant degradation?
- Because either: a) The change wasn't properly tested with representative user data b) An unexpected interaction occurred between the new algorithm and existing systems c) A critical feature or signal is now missing or corrupted in the pipeline
Data Quality Hypothesis:
-
Why did recommendation relevance drop by 45%?
- Because recommendations don't match what users want to watch.
-
Why don't recommendations match user preferences?
- Because the system's understanding of user preferences is inaccurate.
-
Why is the system's understanding inaccurate?
- Because the data it's learning from is corrupted, biased, or incomplete.
-
Why is the training data problematic?
- Because either data collection, processing, or integration systems have failed.
-
Why did these systems fail?
- Because either: a) A data pipeline broke or changed format b) A critical data source was removed or modified c) Data validation checks were insufficient or bypassed
Product Change Hypothesis:
-
Why did recommendation relevance drop by 45%?
- Because users are engaging less with recommendations.
-
Why are users engaging less?
- Because the recommendations are less visible, accessible, or compelling in the interface.
-
Why are recommendations less effective in the interface?
- Because recent UI/UX changes altered how recommendations are presented.
-
Why did these UI/UX changes have such a negative impact?
- Because they fundamentally changed the user's discovery journey.
-
Why was this impact not caught before release?
- Because either: a) Testing focused on engagement metrics but not recommendation relevance b) The testing period or sample size was insufficient c) The negative impact only emerges over longer usage periods
Based on this analysis, I believe the most likely root cause is a combination of technical issues and data quality problems. The sudden 45% drop strongly suggests a specific triggering event rather than gradual user behavior shifts. Most likely, a recent algorithm update or data pipeline change has fundamentally altered how recommendations are generated or what inputs they consider.
The correlation vs. causation distinction is important here - we need to verify that the suspected change actually caused the drop rather than just coinciding with it. This requires careful A/B testing and controlled rollbacks to isolate the impact.
Step 8
Validation and Next Steps (5 minutes)
To validate our hypotheses and address the issue, I propose the following approach:
| Hypothesis | Validation Method | Success Criteria | Timeline |
|---|---|---|---|
| Algorithm Regression | Rollback recent algorithm changes and monitor impact | Recommendation relevance improves to within 10% of baseline | 24-48 hours |
| Data Pipeline Issue | Audit data pipeline integrity and recent changes | Identify specific data quality issues or pipeline failures | 24-72 hours |
| UI/UX Impact | A/B test with previous UI version | Determine if UI changes contributed to relevance drop | 3-5 days |
| Content-Preference Mismatch | Analyze content engagement patterns | Identify shifts in content preferences not reflected in recommendations | 3-7 days |
Immediate actions would include:
-
Emergency Response:
- Implement a partial rollback of the most recent algorithm changes to stabilize performance
- Enable enhanced monitoring of recommendation quality metrics
- Form a cross-functional task force with engineering, data science, and product teams
-
Diagnostic Deep Dive:
- Conduct comprehensive audit of the recommendation pipeline
- Compare recommendation outputs from before and after the drop
- Analyze user engagement patterns with recommendations by segment
- Review all recent code and configuration changes
-
Short-term Mitigation:
- If rollback improves metrics, maintain rollback while developing a fixed version
- If data quality issues are identified, implement data validation and correction
- Consider boosting editorial recommendations temporarily while fixing algorithmic ones
Success would be measured by:
- Recovery of recommendation relevance metric to within 10% of previous baseline
- No negative impact on related metrics like user engagement and retention
- Identification of specific root causes with documented fixes
Potential risks include:
- Rollbacks might affect other dependent systems
- Quick fixes might introduce new issues if not properly tested
- User trust in recommendations might take time to rebuild even after technical fixes
Step 9
Decision Framework (3 minutes)
Based on our validation results, here's a decision framework for addressing the root cause:
| Condition | Action 1 | Action 2 |
|---|---|---|
| Algorithm regression confirmed | Roll back to last stable algorithm version | Develop fixed algorithm with proper A/B testing |
| Data pipeline issue confirmed | Restore data integrity and reprocess affected periods | Implement additional data quality checks and alerts |
| UI/UX impact confirmed | Revert problematic UI elements | Redesign with focus on recommendation visibility and relevance |
| Content library mismatch confirmed | Adjust recommendation weights for available content | Update content acquisition strategy based on preference gaps |
| Multiple issues identified | Prioritize fixes based on estimated impact | Implement staged rollout with careful monitoring |
| No clear cause identified | Implement broader A/B testing framework | Consider fundamental review of recommendation architecture |
This framework ensures we have clear action paths regardless of what our validation reveals, allowing for quick decision-making while maintaining rigor in our approach.
Step 10
Resolution Plan (2 minutes)
Immediate Actions (24-48 hours)
- Roll back the most recent algorithm deployment that correlates with the drop
- Implement emergency monitoring dashboard for recommendation quality
- Establish war room with key stakeholders from engineering, data science, and product
- Communicate transparently with leadership about the issue, impact, and resolution timeline
Short-term Solutions (1-2 weeks)
- Conduct thorough post-mortem of the incident
- Implement fixes for identified issues with proper A/B testing
- Enhance monitoring systems to detect recommendation quality issues earlier
- Review and improve testing protocols for recommendation algorithm changes
- Develop fallback mechanisms for recommendation system failures
Long-term Prevention (1-3 months)
- Redesign the recommendation testing framework to better catch relevance issues
- Implement automated canary analysis for recommendation quality
- Develop more robust data quality validation throughout the pipeline
- Create a recommendation system resilience strategy
- Review the overall recommendation architecture for potential improvements
This approach addresses not just the immediate issue but also builds in safeguards to prevent similar problems in the future. It considers implications for the entire Netflix ecosystem, recognizing that recommendations are central to the user experience and content discovery journey.
.png)