Introduction
Google Pay/Wallet is a digital payment platform that enables users to make payments, store cards, and manage financial transactions. Measuring its success requires a comprehensive approach that balances user adoption, transaction volume, merchant integration, and overall ecosystem health. I'll follow a structured framework that covers core metrics, supporting indicators, and risk factors while considering all key stakeholders.
Step 1
Product Context
Google Pay/Wallet serves as Google's unified payment platform, combining digital wallet functionality with payment processing capabilities. It allows users to:
- Store payment cards, loyalty cards, and transit passes
- Make contactless payments in physical stores
- Complete online transactions across websites and apps
- Send and receive money between individuals
- Access offers and rewards
Key Stakeholders:
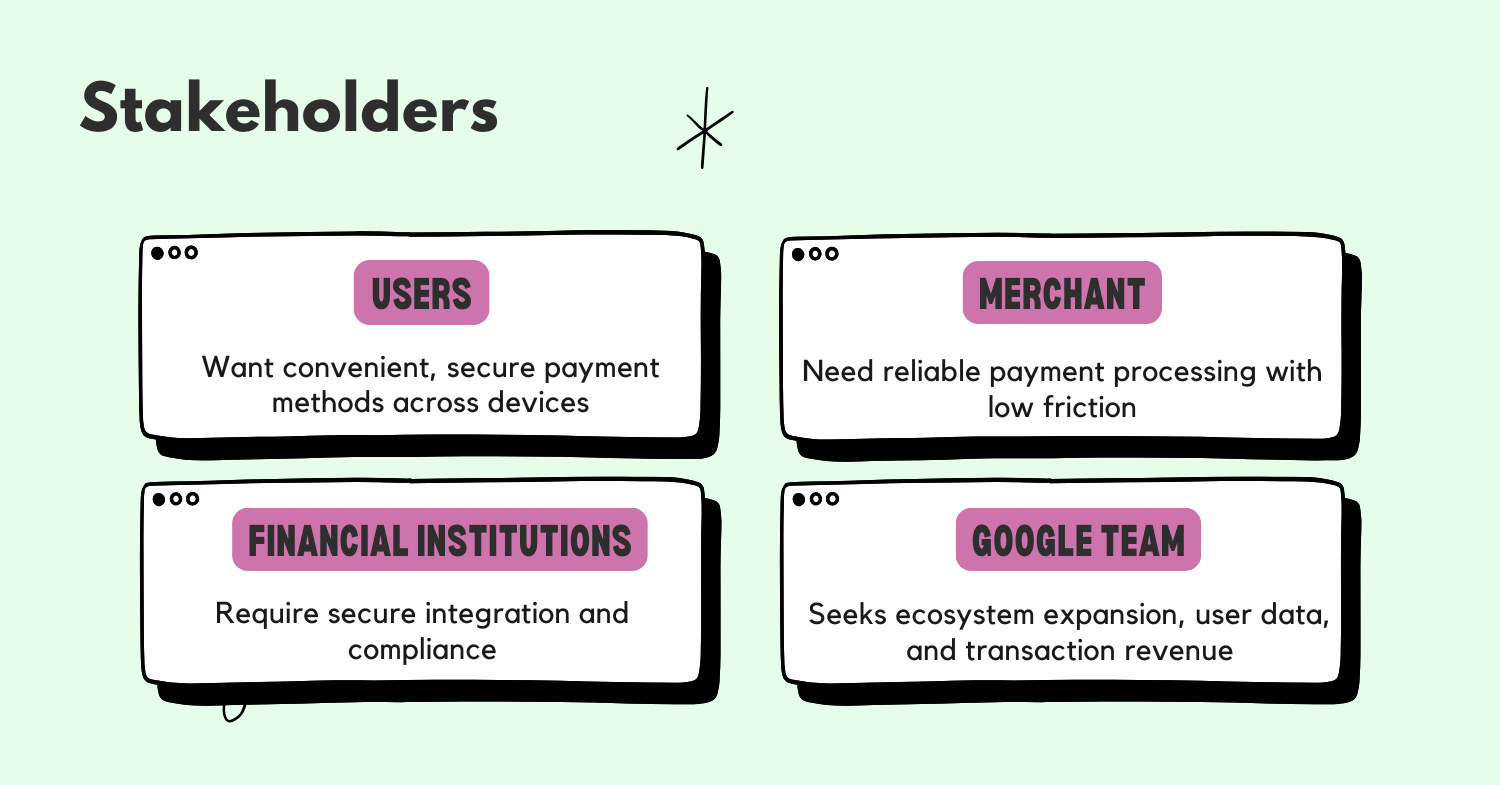
- Users: Want convenient, secure payment methods across devices
- Merchants: Need reliable payment processing with low friction
- Financial institutions: Require secure integration and compliance
- Google: Seeks ecosystem expansion, user data, and transaction revenue
- Regulators: Demand compliance with financial regulations and data privacy
User Flow:
- Onboarding: Users add payment methods to their Google account, verifying identity and linking cards/accounts
- Transaction initiation: Users select Google Pay at checkout (online or in-store) or choose to send money to contacts
- Authentication: Users confirm transactions via biometrics, PIN, or password
- Completion: Transaction processes through financial networks, with confirmation sent to all parties
Strategic Fit: Google Pay/Wallet fits into Google's broader ecosystem strategy by:
- Strengthening the Android platform value proposition
- Collecting valuable transaction data to enhance advertising and services
- Creating additional touchpoints with users throughout their daily activities
- Building financial services infrastructure that could expand to other offerings
Competitive Landscape: Google Pay competes directly with Apple Pay in the mobile wallet space, with Apple having stronger hardware integration but more limited reach. PayPal offers similar functionality with broader merchant acceptance, while regional players like Paytm (India) and WeChat Pay (China) dominate specific markets with super-app approaches.
Product Lifecycle Stage: Google Pay is in the growth/maturity phase, having consolidated previous payment products (Android Pay, Google Wallet) into a unified offering. The core functionality is established, but expansion opportunities exist in merchant adoption, international markets, and additional financial services.
Software-Specific Context:
- Platform/Tech Stack: Android and iOS mobile apps, web SDK, server-side APIs
- Integration Points: Payment processors, banking systems, merchant POS systems, e-commerce platforms
- Deployment Model: Cloud-based with client-side components, regular update cycles
Step 2
Goals
| Core Goals | User Goals | Technical Goals | Business Goals |
|---|---|---|---|
| Drive payment transaction volume | Complete payments quickly and securely | Maintain 99.99% uptime and transaction success | Increase Google ecosystem engagement |
| Expand merchant acceptance | Access payment methods across devices/contexts | Ensure data security and regulatory compliance | Generate revenue through transaction fees |
| Increase active user base | Manage financial information in one place | Scale infrastructure to handle peak volumes | Gather valuable transaction data |
| Enhance financial services ecosystem | Receive personalized offers and rewards | Reduce latency in payment processing | Compete effectively with Apple Pay and PayPal |
Step 3
North Star Metric
 For Google Pay/Wallet, the North Star Metric should be Monthly Transacting Users (MTU) × Average Transaction Value (ATV), which effectively represents the Total Payment Volume (TPV).
This metric captures the fundamental value of the payment platform by measuring both adoption (number of users) and engagement (transaction value). It directly correlates with revenue generation through transaction fees and reflects the platform's utility to both users and merchants.
Definition and Calculation:
- Monthly Transacting Users: Unique users who complete at least one transaction via Google Pay in a calendar month
- Average Transaction Value: Total transaction value divided by number of transactions
- TPV = MTU × Average Transactions per User × ATV
Stakeholder Value Alignment:
- Users: Higher TPV indicates the platform is meeting payment needs across contexts
- Merchants: Growing TPV demonstrates increasing consumer preference for Google Pay
- Financial institutions: Larger TPV justifies integration investment
- Google: TPV directly correlates with revenue and ecosystem strength
- Regulators: Stable, growing TPV suggests a healthy, compliant system
Hypothetical Data Example: If Google Pay has 150 million MTU with an average of 5 transactions per user at $35 ATV, the monthly TPV would be $26.25 billion. A healthy trend would show steady growth in all three components, with particular attention to MTU growth in new markets and ATV growth in established ones.
Breakdown North Star Metric
The North Star Metric (TPV) can be broken down into its component parts to better understand performance drivers:
Formula Breakdown:
- TPV = MTU × Transactions per User × ATV
- MTU = New Users + Retained Users
- Transactions per User = f(In-store, Online, P2P)
- ATV = f(Purchase Category, Market/Region, User Segment)
This is generally the time to take your first 1-2 minutes break to organize your thoughts before diving into the next step.
Step 4
Supporting Metrics
| Metric | Importance | Calculation | Actions |
|---|---|---|---|
| User Activation Rate | Measures onboarding effectiveness | (Users who complete first transaction) ÷ (Users who start setup) | Simplify onboarding, add contextual guidance, improve verification processes |
| Merchant Coverage | Indicates payment utility for users | (Merchants accepting Google Pay) ÷ (Total addressable merchants in market) | Target high-value merchant segments, improve integration tools, offer incentives |
| Weekly Active Rate | Shows engagement frequency | (Weekly active users) ÷ (Monthly active users) | Enhance everyday use cases, improve payment speed, add contextual triggers |
| Cross-Platform Usage | Demonstrates ecosystem strength | % of users transacting on multiple platforms (Android, iOS, web) | Improve cross-platform consistency, sync capabilities, unified experience |
| Feature Adoption | Indicates product depth | % of users using multiple features (payments, passes, offers) | Promote underutilized features, improve feature discovery, create feature bundles |
| Transaction Success Rate | Measures technical reliability | (Successful transactions) ÷ (Attempted transactions) | Address failure points, improve error handling, enhance network resilience |
Step 5
Guardrail Metrics
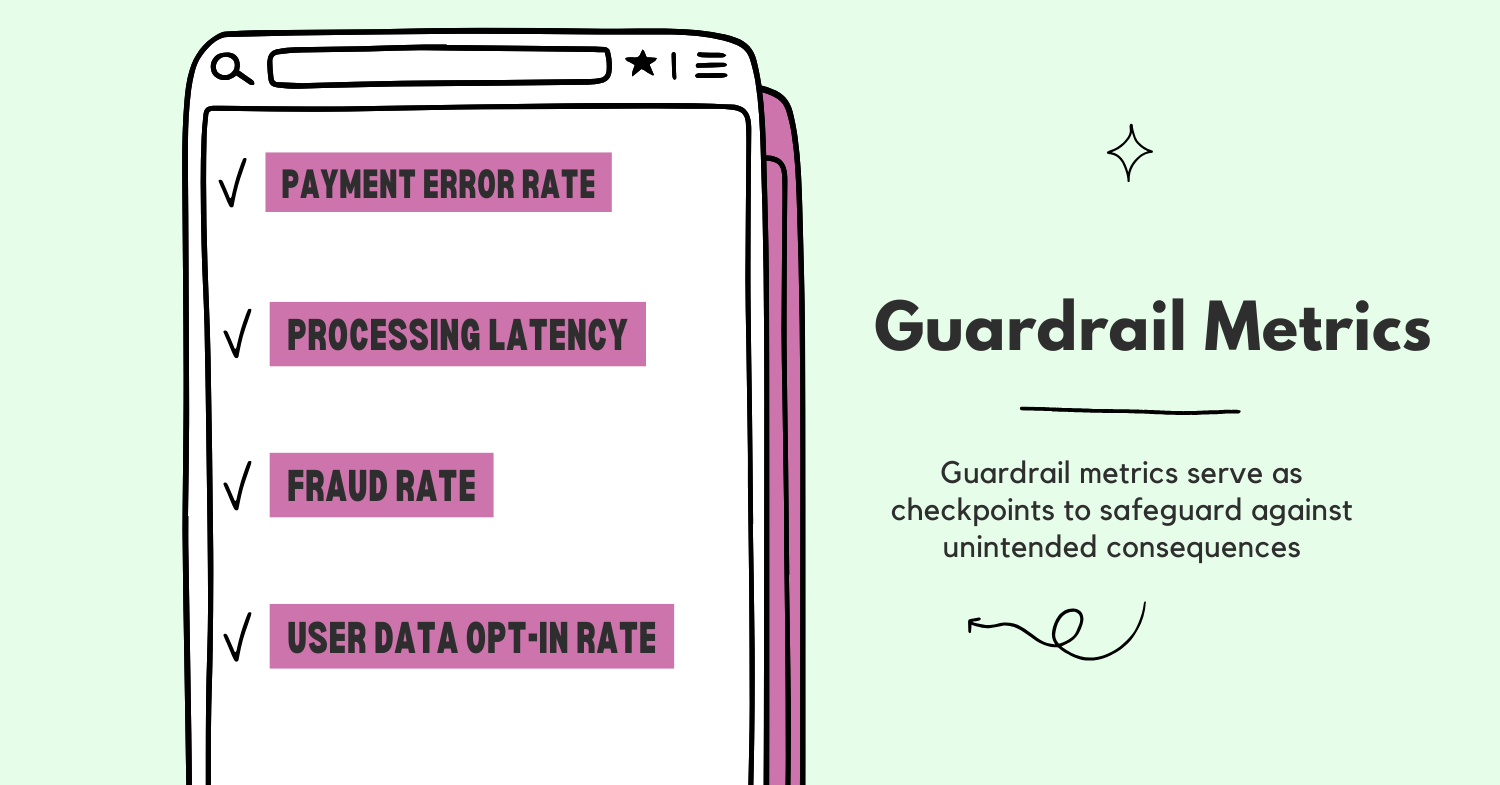
| Key Stakeholder | Metric | Why It Matters | Threshold |
|---|---|---|---|
| Users | Payment Error Rate | Directly impacts trust and continued usage | <2% of transactions |
| Merchants | Processing Latency | Affects checkout experience and customer satisfaction | <3 seconds for 95% of transactions |
| Financial Institutions | Fraud Rate | Determines financial risk and compliance costs | <0.1% of transaction volume |
| User Data Opt-in Rate | Balances personalization capabilities with privacy concerns | >70% opt-in for transaction history | |
| Regulators | Compliance Violation Rate | Ensures regulatory standing and avoids penalties | Zero critical violations |
Payment Error Rate is critical because each failed transaction creates immediate user frustration and potential abandonment. When this rises above 2%, we typically see a corresponding drop in our North Star Metric as users switch to alternative payment methods. We monitor this hourly and have automated alerts when approaching threshold.
Processing Latency directly impacts the checkout experience, with research showing abandonment rates increase dramatically when payments take longer than 3 seconds. Merchants will remove Google Pay as an option if latency consistently exceeds this threshold, directly impacting our merchant coverage metric.
Fraud Rate requires careful balance - too much friction in fraud prevention hurts conversion, while too little increases financial risk. We've found 0.1% represents the optimal balance point where financial institutions remain confident in the platform without excessive user friction.
User Data Opt-in Rate is essential for Google's ability to provide personalized experiences and offers, which drive engagement. However, pushing too aggressively for data sharing can trigger privacy concerns and regulatory scrutiny. The 70% threshold allows for meaningful data insights while respecting user choice.
Compliance Violation Rate must remain at zero for critical regulations, as violations can result in service suspension in key markets. We track this through regular audits and have established a compliance review process for all feature releases.
Step 6
Trade-off Metrics
Security vs. Convenience:
- Metrics in tension: Authentication Success Rate vs. Fraud Prevention Rate
- Trade-off: Stronger authentication reduces fraud but increases friction
- Balancing strategy: Implement risk-based authentication that adjusts security requirements based on transaction characteristics and user behavior patterns. For low-risk transactions, use streamlined authentication, while applying stricter measures for unusual activity.
Growth vs. Quality:
- Metrics in tension: User Acquisition Rate vs. User Retention Rate
- Trade-off: Aggressive acquisition tactics may bring in less qualified users who don't retain
- Balancing strategy: Focus on acquisition channels with proven retention, implement cohort analysis to identify high-value user segments, and create onboarding experiences tailored to user intent signals.
Monetization vs. Adoption:
- Metrics in tension: Revenue per Transaction vs. Transaction Volume
- Trade-off: Higher fees increase per-transaction revenue but may reduce overall volume
- Balancing strategy: Implement tiered fee structures based on merchant size and transaction volume, offer value-added services that justify premium pricing, and create incentive programs that reward volume growth.
Feature Breadth vs. Core Experience:
- Metrics in tension: Feature Usage Breadth vs. Core Transaction Success
- Trade-off: Adding features may complicate the experience and dilute core functionality
- Balancing strategy: Maintain strict performance requirements for core payment flows, implement progressive disclosure of advanced features, and conduct regular experience audits to prevent feature bloat.
Step 7
Counter Metrics
1. User Churn Rate
- Purpose: Ensures growth in MTU represents genuine adoption, not just temporary usage
- Potential pitfall avoided: Prevents focusing on acquisition while ignoring retention issues
- Action threshold: If monthly churn exceeds 5%, investigate user segments with highest drop-off and conduct exit surveys to identify friction points
2. Average Sessions Before First Transaction
- Purpose: Measures onboarding efficiency and initial friction
- Potential pitfall avoided: Prevents complex setup processes that technically "work" but frustrate users
- Action threshold: If users require more than 2 sessions to complete their first transaction, redesign the onboarding flow with fewer steps and clearer guidance
3. Support Ticket Rate
- Purpose: Identifies user confusion and technical issues not captured in success metrics
- Potential pitfall avoided: Prevents shipping problematic features that technically "work" but generate user confusion
- Action threshold: If support tickets exceed 1 per 1,000 transactions, analyze common issues and implement UI improvements or educational content
Strategic Initiatives
Based on the metrics framework, I'd propose these strategic initiatives:
1. Merchant Activation Program
- Rationale: Merchant coverage directly impacts utility for users and drives transaction volume
- Metric impact: Would increase MTU, transactions per user, and merchant coverage
- Implementation challenges: Requires coordination across sales, partnerships, and technical integration teams; may need market-specific approaches
2. Cross-Platform Experience Enhancement
- Rationale: Users increasingly switch between devices and contexts during shopping journeys
- Metric impact: Would improve cross-platform usage, weekly active rate, and retention
- Implementation challenges: Requires alignment across platform teams with different priorities and technical constraints; needs consistent design language
3. Financial Insights Layer
- Rationale: Adding value beyond transactions creates stickiness and differentiates from competitors
- Metric impact: Would increase feature adoption, retention, and potentially ATV
- Implementation challenges: Requires careful privacy considerations, additional data processing capabilities, and potential regulatory review
Conclusion
Google Pay/Wallet success metrics must evolve as the payment landscape changes. Emerging technologies like blockchain-based payments and central bank digital currencies may require new metrics focused on interoperability. Similarly, as embedded finance grows, measuring success through standalone transactions may become less relevant than measuring integration quality across Google's ecosystem.
The rise of super-apps in global markets suggests Google Pay may need to expand its definition of success beyond payments to include broader financial services engagement. This would require metrics that capture the full user journey across financial products and services.
.png)