
Introduction
I'm looking at the challenge of introducing ads into our product and determining the optimal number to show. This is fundamentally a balancing act between monetization and user experience, with significant implications for our business model and user retention. I'll walk through my approach to this trade-off decision, focusing on understanding the ecosystem, establishing clear metrics, and creating a data-driven framework for making this decision.
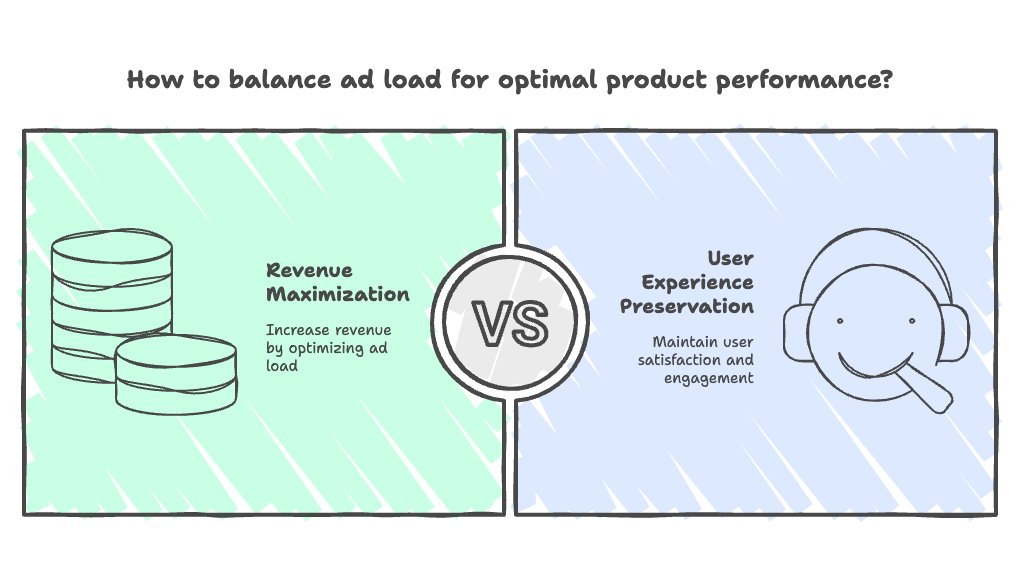
I'd like to start by understanding the context better, then outline a structured approach to balance revenue generation with user experience preservation. Does that align with what you're looking for in this discussion?
Step 1
Clarifying Questions (3 minute)
- Why it matters: Helps determine if users are already accustomed to ads or if this is a new experience
- Expected answer: Enhancing existing ad strategy
- Impact on approach: If new, would require more conservative introduction and education; if existing, can focus on optimization
- Why it matters: Different user segments have different ad sensitivity and value to the business
- Expected answer: Premium users are most valuable and most sensitive to ad intrusion
- Impact on approach: Would suggest segment-specific ad strategies rather than one-size-fits-all
- Why it matters: Highly relevant ads are less intrusive and may allow for higher ad density
- Expected answer: We have moderate targeting capabilities with room for improvement
- Impact on approach: Would influence whether to focus on ad quality improvements before increasing quantity
- Why it matters: Provides context for user expectations and competitive positioning
- Expected answer: Competitors show 3-5 ads per session with mixed results
- Impact on approach: Would help establish initial boundaries for testing
- Why it matters: Helps balance short-term revenue needs against long-term user experience considerations
- Expected answer: Targeting 20% revenue growth within 12 months
- Impact on approach: Would influence how aggressive our testing and rollout strategy should be
Step 2
Trade-off Type Identification (1 minute)
Identify which sub-type of trade-off question you're dealing with:
This is primarily a Type B trade-off: same product with different variations. We're determining how many ads to show within our existing product experience, which means we're creating variations of the same core product with different ad densities.
This identification informs our approach by focusing on user experience consistency across variations while carefully measuring how different ad loads affect key metrics. Rather than comparing entirely different products or features competing for the same space, we're optimizing a single variable (ad quantity) within our existing product framework. This allows for more controlled experimentation and clearer attribution of cause and effect.
Step 3
Product Understanding (5 minutes)
- Our product serves users with content they value, creating an environment where introducing ads represents both an opportunity and a risk
- Key stakeholders include:
- Users who come for content and experience
- Content creators who benefit from platform reach
- Advertisers seeking audience attention
- Our company needing sustainable revenue
- The product's value proposition centers on delivering relevant, engaging content to users while providing a seamless experience
- This aligns with our company mission of connecting people with information and experiences that matter to them
- The core user journey involves discovery, engagement, and return visits, with ads potentially affecting each stage
The user journey shows how ad encounters create decision points that can either maintain engagement or create friction. The number of ads directly impacts how often users hit these potential friction points during their experience.
Step 4
Trade-off Agreement and Hypothesis (5 minutes)
The fundamental trade-off we're facing is between maximizing ad revenue and preserving user experience. More ads generally mean more immediate revenue, but potentially at the cost of user satisfaction, engagement, and long-term retention.
My hypothesis is that there exists an optimal ad load that maximizes long-term revenue by balancing immediate monetization with user experience preservation. This "sweet spot" likely varies by:
- User segment (new vs. established users)
- Content type (immersive vs. casual consumption)
- Session length (tolerance increases with longer sessions)
- Ad relevance and quality
I believe we can identify this optimal point through careful experimentation and measurement.
Potential impacts
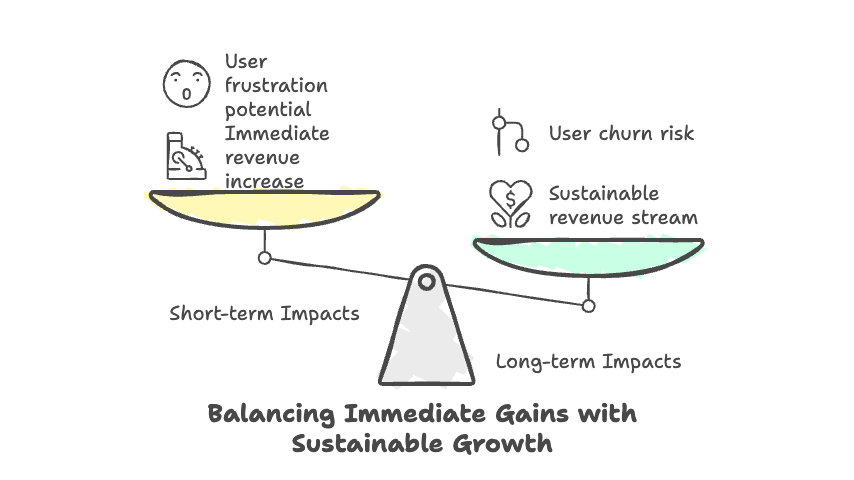
| Impact | Positive Impacts | Negative Impacts |
|---|---|---|
| Short-term | Immediate revenue increase with each additional ad | User frustration, reduced session time, negative feedback |
| Long-term | Sustainable revenue stream, improved ad targeting capabilities | User churn, brand damage, reduced organic growth |
For power users who spend significant time on our platform, ad fatigue could become a major issue with high ad loads. Casual users might be less sensitive to ad frequency but more sensitive to relevance. The platform itself risks becoming perceived as "ad-heavy" if we cross certain thresholds, damaging our brand positioning.
If we consistently show too few ads, we leave revenue on the table and might struggle to sustain our business model. If we show too many, we risk a downward spiral where declining engagement leads to showing even more ads to compensate, further accelerating user exodus.
Step 5
Key Metrics Identification (4 minutes)
Our North Star metric should be Revenue Per User Session, which balances immediate monetization with session health. This metric captures both sides of our trade-off: ad revenue generation and maintaining user engagement.
Supporting metrics to monitor:
-
Session Duration - Measures if ads are causing users to cut sessions short
- Important because it indicates user engagement and satisfaction
- Relates to both user value and advertiser value (more exposure time)
-
Return Rate (1-day, 7-day) - Tracks if ad load affects user return behavior
- Critical for long-term platform health and growth
- Leading indicator of potential churn issues
-
Ad Engagement Rate - Measures if users find ads relevant and valuable
- Indicates ad quality and targeting effectiveness
- Important to advertisers and affects their willingness to pay
-
Content Consumption Per Session - Tracks if ads are reducing content engagement
- Core to our value proposition of connecting users with content
- Affects creator satisfaction and platform vitality
-
User Satisfaction Score - Direct feedback on experience quality
- Leading indicator of potential retention issues
- Helps identify threshold where ad load becomes problematic
-
Revenue Per Impression - Measures ad effectiveness and quality
- Helps determine if fewer, higher-quality ads might be more profitable
- Indicates advertiser value perception
Step 6
Experiment Design (3 minutes)
I'd design an A/B/C/D test with varying ad loads to identify the optimal balance point:
Experiment Hypothesis: There exists an optimal number of ads per session that maximizes long-term revenue without significantly degrading user experience metrics.
- Control Group (A): Current ad load (baseline)
- Treatment Group B: 25% increase in ad frequency
- Treatment Group C: 25% decrease in ad frequency
- Treatment Group D: 50% increase in ad frequency
Target Audience:
- 5% of our user base for each variant (20% total)
- Stratified sample across user segments (new users, casual users, power users)
- Minimum of 100,000 users per variant for statistical significance
Duration: 4 weeks (to account for novelty effects and capture return behavior)
Key Considerations:
- Random assignment using user ID hashing to ensure consistent experience
- Pre-experiment power analysis to confirm sample size adequacy
- Guardrail metrics include 7-day retention rate and user satisfaction scores
- Segment analysis built into the experiment design
Step 7
Data Analysis Plan (3 minutes)
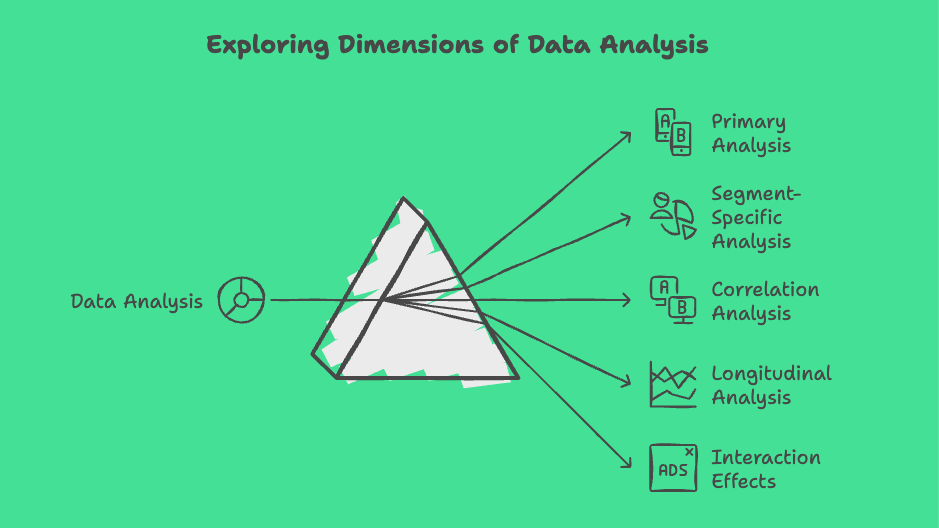
I would analyze the experiment data through several lenses:
-
Primary Analysis: Compare Revenue Per User Session across variants, looking for statistically significant differences.
-
Segment-Specific Analysis:
- Break down results by user type (new vs. established)
- Analyze by usage frequency (daily, weekly, monthly users)
- Examine by platform/device type
- Look at geographic variations
-
Correlation Analysis:
- Measure the relationship between ad load and session duration
- Analyze how ad frequency correlates with return rates
- Determine if there's a threshold where metrics sharply decline
-
Longitudinal Analysis:
- Track metrics over the full 4 weeks to identify any adaptation effects
- Compare week 1 vs. week 4 to see if initial reactions moderate over time
-
Interaction Effects:
- Analyze how ad relevance scores interact with ad load tolerance
- Examine if session length changes the optimal ad frequency
If we see metrics moving in opposite directions (e.g., higher revenue but lower retention), I'd calculate the lifetime value impact using our existing user LTV models to determine if short-term gains outweigh long-term losses.
For anomalies, I'd investigate specific segments or conditions where results deviate significantly from the overall pattern, as these might reveal opportunities for more targeted approaches.
Step 8
Decision Framework (4 minutes)
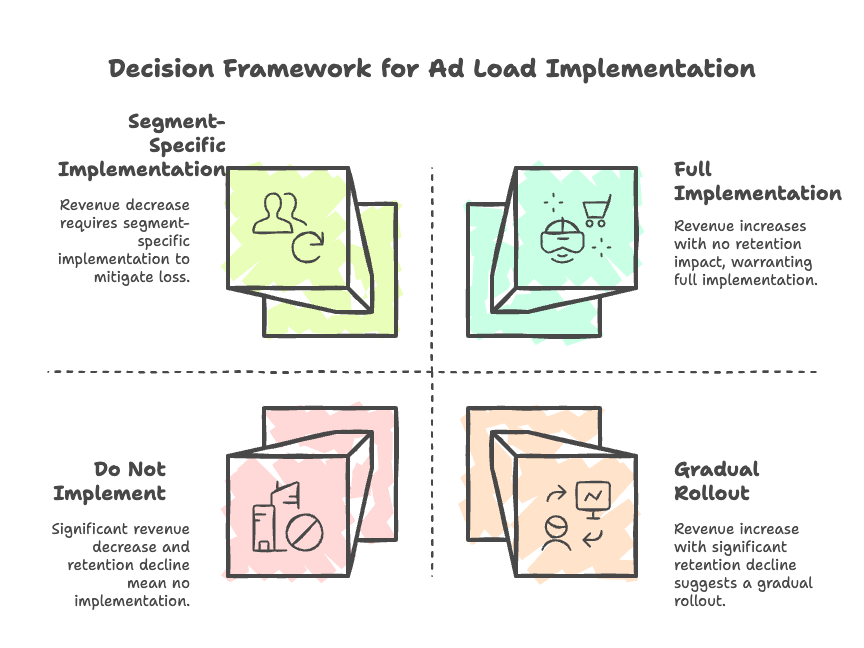
Our decision framework needs to balance immediate revenue with long-term sustainability:
| Condition | Action 1 | Action 2 |
|---|---|---|
| Revenue increases, no significant negative impact on retention metrics | Implement new ad load | Continue monitoring for delayed effects |
| Revenue increases, but retention metrics decline slightly | Implement with segment-specific modifications | Develop mitigation strategies for affected segments |
| Revenue increases, but retention metrics decline significantly | Do not implement, explore alternative approaches | Test intermediate ad loads |
| No significant revenue increase | Do not implement | Investigate ad quality and relevance improvements |
| Mixed results across segments | Implement segment-specific ad loads | Continue testing with refined segmentation |
Red flags that would prevent shipping:
-
5% decline in 7-day return rate
-
10% decline in session duration
- Significant negative impact on user satisfaction scores
- Disproportionate impact on high-value user segments
For mixed or inconclusive results, I would:
- Extend the test duration to capture longer-term effects
- Refine segmentation to identify if certain user groups can tolerate higher ad loads
- Test intermediate values between variants that showed promise
Step 9
Recommendation and Next Steps (3 minutes)
Based on this analysis framework, my recommendation would be to:
- Start with a conservative approach that prioritizes user experience while incrementally testing higher ad loads
- Implement segment-specific ad load strategies based on experiment results
- Focus on improving ad relevance and quality alongside quantity optimization
Next steps would include:
- Refine targeting capabilities to improve ad relevance, potentially allowing for higher ad loads without degrading experience
- Develop dynamic ad load algorithms that adjust based on session length, user behavior, and engagement patterns
- Create premium ad-free options for highly ad-sensitive users who are willing to pay
- Establish ongoing monitoring systems to detect any long-term negative impacts from increased ad loads
- Partner with the creative team to develop less intrusive ad formats that might allow for higher frequency
This approach ensures we're not just optimizing for immediate revenue but building a sustainable advertising model that preserves our core user experience.
.png)