In analyzing this 10% drop in Facebook Business Page likes, I'll follow a systematic framework to identify, validate, and address the root cause while considering both immediate and long-term implications.
The sudden 10% decrease in Facebook Business Page likes over the last month represents a significant metric shift that requires careful investigation. I'll approach this methodically to determine whether this is a technical issue, user behavior change, product modification effect, or external factor.
This analysis follows a structured approach covering issue identification, hypothesis generation, validation, and solution development to address the Facebook Business Page likes decline.
Step 1
Clarifying Questions (3 minute)
- Why it matters: Understanding the scope helps determine if this is a systemic issue or something affecting specific segments.
- Expected answer: Either uniform across all segments or concentrated in particular industries/regions.
- Impact on approach: If isolated to specific segments, we'd focus investigation there first; if global, we'd look at platform-wide changes.
- Why it matters: The pattern could indicate whether this correlates with a specific event or change.
- Expected answer: Either a sharp decline on a specific date or a consistent downward trend.
- Impact on approach: A sudden drop would point us toward investigating specific changes made around that date.
- Why it matters: We need to rule out that this isn't simply a measurement or reporting anomaly.
- Expected answer: Either confirmation of analytics consistency or disclosure of recent changes.
- Impact on approach: If analytics changed, we'd need to validate the actual impact versus reporting differences.
- Why it matters: Product changes often directly impact user behavior and metrics.
- Expected answer: Details about recent updates or confirmation of no significant changes.
- Impact on approach: If changes occurred, we'd analyze their potential relationship to the likes decline.
- Why it matters: Correlated changes in other metrics help establish whether this is an isolated issue or part of a broader engagement trend.
- Expected answer: Information about parallel trends in related metrics.
- Impact on approach: Correlated changes would suggest a broader user behavior shift rather than a likes-specific issue.
Step 2
Rule Out Basic External Factors (3 minutes)
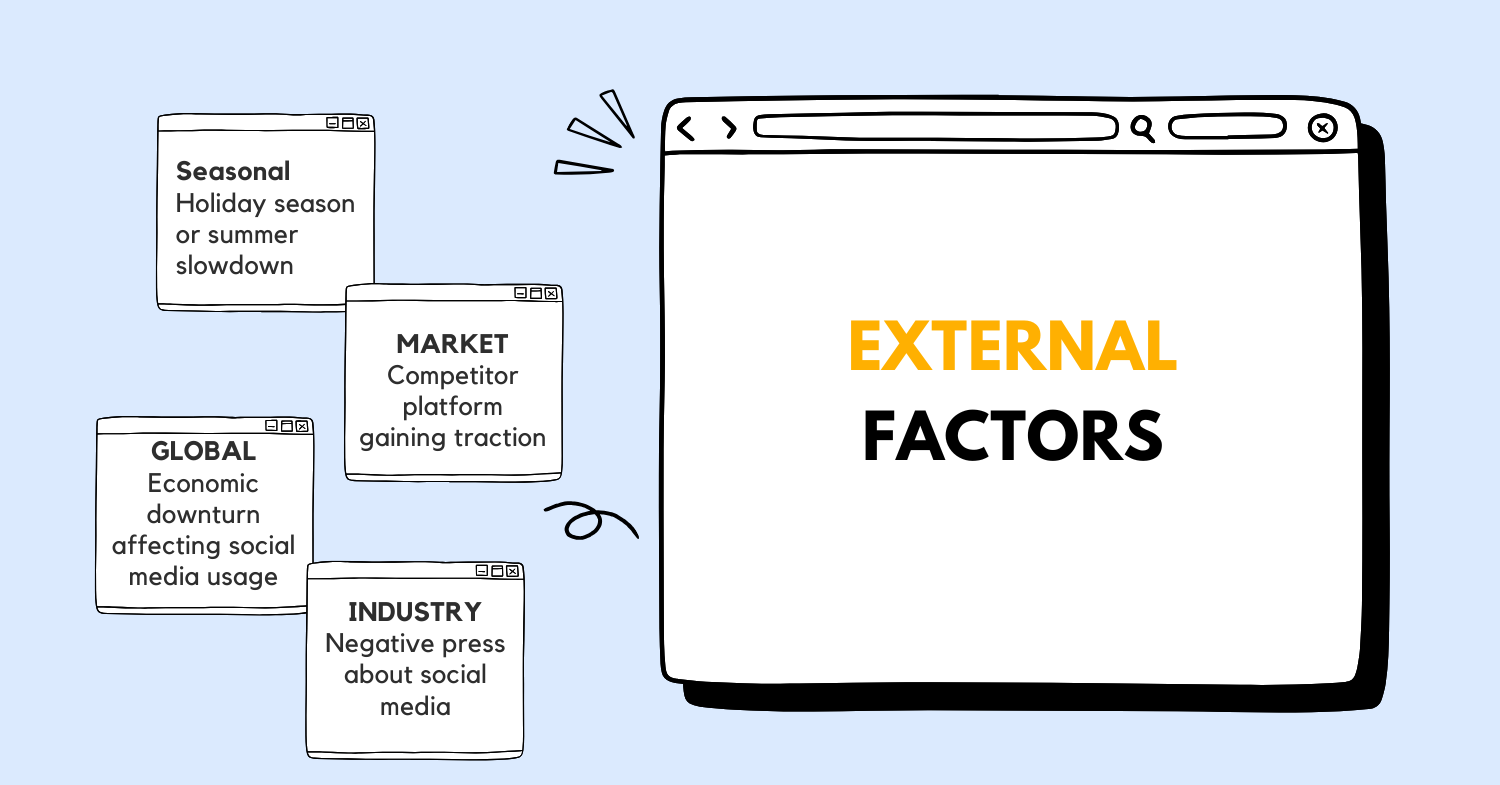 Before diving deeper, let's quickly assess potential external causes that might explain this decline in Facebook Business Page likes:
| Category | Factors | Impact Assessment | Status |
|---|---|---|---|
| Seasonal | Holiday season or summer slowdown | Medium - seasonal engagement patterns can cause temporary fluctuations | Consider - but 10% seems high for normal seasonality |
| Market | Competitor platform gaining traction | Medium - users migrating to other platforms | Consider - would likely see gradual decline rather than sudden drop |
| Global | Economic downturn affecting social media usage | Low - economic factors typically don't cause rapid engagement changes | Rule out - too short timeframe |
| Technical | Facebook outages or performance issues | High - technical problems directly impact engagement | Consider - would align with sudden drops |
| Industry | Negative press about social media | Medium - could cause temporary user exodus | Consider - if aligned with specific news cycles |
The 10% drop seems too significant to be explained by normal seasonal variations alone. While competitor platforms might be gaining traction, such shifts typically manifest as gradual declines rather than sudden drops. Economic factors generally don't cause such rapid changes in engagement metrics.
Technical issues or significant negative press could explain a sudden drop, so these warrant further investigation. However, we should focus on internal factors that might have more direct causality with this specific metric.
When candidates convert the interview into an interrogation of interviewer and asks 20 basic/irrelevant questions. Idea is to quickly highlight that you know how to think about external factors and move on to dig deeper issues.
Step 3
Product Understanding and User Journey (3 minutes)
Facebook Business Pages serve as the digital storefronts for companies on the platform, allowing businesses to build their brand presence, engage with customers, and drive business objectives through social media. The "like" functionality is a core engagement mechanism that:
- Signals user interest in a business's content
- Creates an ongoing connection between users and businesses
- Contributes to the page's perceived popularity and credibility
- Affects content distribution in users' feeds
The typical user journey for liking a Business Page includes:
- Discovery: User encounters the page through search, ads, recommendations, or shared content
- Evaluation: User assesses page content, reviews, and overall value proposition
- Decision: User decides to "like" the page to follow updates
- Engagement: User receives and interacts with page content in their feed
- Retention: User maintains the connection or potentially unlikes the page later
Edge cases in this journey include:
- Users who like pages for one-time promotions then unlike
- Mass liking behavior from bots or inauthentic accounts
- Business-initiated like campaigns that might have recently ended
- Users who unlike pages after feed algorithm changes affect content visibility
The 10% drop in likes could represent disruption at any stage of this journey - reduced discovery, changed evaluation criteria, altered decision factors, or increased unlikes due to retention issues.
Step 4
Metric Breakdown (3 minutes)
Let's precisely define and break down the "likes on Facebook Business Pages" metric:
The net number of likes on Business Pages represents the cumulative total of new likes minus unlikes over a given period. A 10% drop could result from either fewer new likes, more unlikes, or a combination of both.
This metric can be further segmented by:
- Business size (small, medium, large enterprises)
- Industry vertical (retail, services, entertainment, etc.)
- Geographic region
- Page activity level (posting frequency)
- Page age (new vs. established)
Understanding these components helps identify where in the system the issue might be occurring. For example, if we're seeing stable new likes but increased unlikes, that points to a retention problem. Conversely, if new likes have decreased while unlikes remain stable, we'd focus on acquisition channels.
I'd work with our data science team to segment this data and identify patterns across these dimensions to pinpoint where the most significant drops are occurring.
Step 5
Data Gathering and Prioritization (3 minutes)
To investigate this issue thoroughly, I would request the following data:
| Data Type | Purpose | Priority | Source |
|---|---|---|---|
| Like/Unlike Ratio | Determine if issue is acquisition or retention | High | Analytics Dashboard |
| Page Like Sources | Identify which acquisition channels changed | High | Page Insights |
| Geographic Distribution | Locate regional patterns | Medium | Analytics Dashboard |
| Industry Segment Analysis | Identify affected business categories | High | Business Categorization Data |
| Algorithm Change Log | Correlate with potential distribution changes | High | Engineering Team |
| Feature Deployment Timeline | Identify recent product changes | High | Product Team |
| User Feedback | Qualitative insights on engagement changes | Medium | Support/Community Teams |
| Error Logs | Identify technical issues affecting like functionality | Medium | Engineering Team |
| Competitor Analysis | Compare trends across social platforms | Low | Market Research |
| Content Performance | Correlation between content types and engagement | Medium | Content Analytics |
I'm prioritizing data that helps distinguish between acquisition and retention issues, as these require fundamentally different solutions. Understanding which segments are most affected will help narrow our focus, while the algorithm and feature deployment data will help identify if internal changes are responsible.
I'd first analyze the like/unlike ratio to determine the nature of the problem, then examine the most affected segments to look for patterns, before correlating with recent product or algorithm changes.
Step 6
Hypothesis Formation (6 minutes)
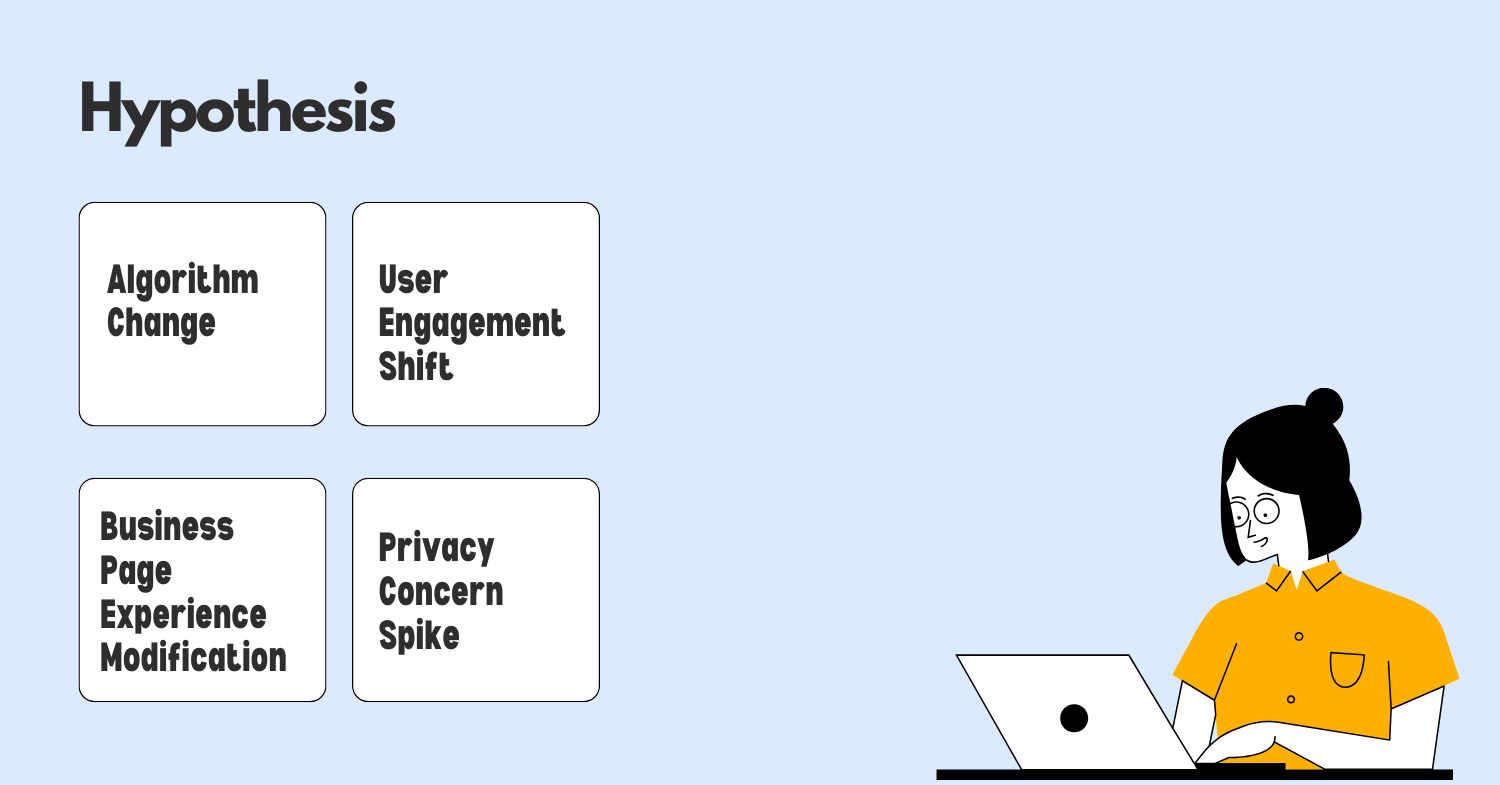 Based on the information available, I've developed four primary hypotheses that could explain the 10% drop in Facebook Business Page likes:
1. Technical Hypothesis: Algorithm Change Impact
Evidence points:
- The drop occurred suddenly rather than gradually
- Facebook regularly updates its algorithms that determine content visibility
- Algorithm changes typically affect engagement metrics across the platform
Impact assessment: If Facebook recently modified its News Feed algorithm to prioritize different content types or sources, Business Page content may have received reduced visibility, directly impacting discovery and engagement opportunities that lead to likes.
Validation approach: Compare the timeline of the likes drop with any algorithm updates. Analyze changes in page reach and impressions metrics to see if they correlate with the likes decline.
2. User Behavior Hypothesis: Shift in Engagement Preferences
Evidence points:
- Users may be changing how they interact with businesses on social platforms
- Younger demographics show different platform usage patterns
- Content consumption behaviors evolve over time
Impact assessment: Users might be shifting toward more passive consumption or different engagement mechanisms (comments, shares) rather than likes, which represent a more permanent connection to businesses.
Validation approach: Analyze other engagement metrics during the same period. Survey users about their engagement preferences. Compare behavior across demographic segments.
3. Product Change Hypothesis: Business Page Experience Modification
Evidence points:
- Facebook regularly updates its Business Page features and UI
- Changes to page layouts or like button prominence could affect engagement
- Mobile app updates might have altered the visibility of like functionality
Impact assessment: Recent changes to how Business Pages appear or function might have created friction in the like process or reduced the prominence of like buttons/prompts.
Validation approach: Review all recent Business Page UI/UX changes. Conduct A/B testing with different button placements. Analyze the drop across device types to identify platform-specific issues.
4. External Factor Hypothesis: Privacy Concern Spike
Evidence points:
- Social media platforms face ongoing scrutiny around data usage
- Privacy concerns can drive changes in user behavior
- Recent news cycles may have heightened awareness
Impact assessment: Users might be reducing their digital footprint by unliking business pages due to increased privacy concerns, particularly if there were recent high-profile stories about data usage.
Validation approach: Correlate the timing of the drop with privacy-related news. Analyze whether unlikes increased during this period. Survey users about privacy concerns influencing their engagement decisions.
Based on the sudden nature of the drop and Facebook's history of algorithm adjustments, the Algorithm Change hypothesis seems most plausible as an initial focus, though multiple factors could be contributing simultaneously.
Step 7
Root Cause Analysis (5 minutes)
Let's apply the "5 Whys" technique to our most promising hypothesis - the Algorithm Change Impact:
Why #1: Why did Business Page likes drop by 10%? Because users are liking fewer pages and/or unliking more pages than before.
Why #2: Why are users liking fewer pages/unliking more pages? Because they're seeing less Business Page content in their feeds that would prompt engagement and likes.
Why #3: Why are users seeing less Business Page content? Because the News Feed algorithm appears to have changed how it prioritizes and distributes Business Page content.
Why #4: Why would the algorithm change to reduce Business Page content visibility? Because Facebook may be prioritizing personal connections and interactions over business content to improve user satisfaction and time spent on platform.
Why #5: Why would Facebook make this strategic shift now? Because internal metrics likely showed that users engage more deeply with personal content, and Facebook is constantly optimizing for engagement metrics that drive their core business.
For our second most likely hypothesis - Product Change Impact:
Why #1: Why did Business Page likes drop by 10%? Because the user experience for discovering and liking pages has changed.
Why #2: Why has the experience changed? Because Facebook implemented UI/UX updates to Business Pages or the like functionality.
Why #3: Why would these updates reduce like activity? Because they may have inadvertently created friction in the like process or reduced the prominence of like buttons.
Why #4: Why would Facebook make changes that reduce likes? Because they may be optimizing for different metrics now, such as meaningful interactions over simple likes.
Why #5: Why shift focus from likes to other metrics? Because Facebook's strategy may be evolving toward deeper engagement rather than broad, shallow connections.
Distinguishing correlation from causation is critical here. To establish causation, we would need to:
- Confirm the exact timing of the drop aligns with specific changes
- Observe similar patterns across different segments affected by the same change
- Rule out other simultaneous factors
- Test reversing the suspected change to see if metrics recover
Based on this analysis, the algorithm change hypothesis seems most plausible as the primary driver, with potential contributions from product changes. Both point to a strategic shift in how Facebook is prioritizing content and engagement, which would require adaptation in our approach to Business Pages.
Step 8
Validation and Next Steps (5 minutes)
To validate our hypotheses and determine the appropriate course of action, I propose the following validation methods:
| Hypothesis | Validation Method | Success Criteria | Timeline |
|---|---|---|---|
| Algorithm Change | A/B test with boosted posts to bypass algorithm | Boosted content shows normal like rates | 1 week |
| Algorithm Change | Correlation analysis between News Feed reach and like rate | Strong statistical correlation | 3 days |
| Product Change | Heatmap analysis of user interaction with like buttons | Identify changes in click patterns | 1 week |
| User Behavior | Cohort analysis of engagement patterns | Identify shifts in how users interact | 1 week |
| Privacy Concerns | User survey targeting recent "unlikers" | Clear patterns in stated reasons | 2 weeks |
For our most likely hypothesis - algorithm changes - I would immediately:
-
Analyze content reach data: Compare the reach of Business Page content before and after the observed drop to confirm visibility changes.
-
Conduct controlled tests: Create test content with varying characteristics to identify what factors might now be influencing distribution.
-
Engage with Facebook: Reach out to our Facebook partnership team to inquire about recent algorithm changes affecting Business Pages.
Short-term solutions (1-2 weeks):
- Develop guidance for businesses on content types that perform better under the new algorithm
- Implement A/B testing on post formats to identify what drives engagement now
- Create educational resources for businesses on adapting to the changes
Long-term strategies (1-3 months):
- Develop new features that encourage meaningful engagement beyond likes
- Redesign the Business Page experience to optimize for current algorithm priorities
- Create analytics tools that help businesses understand and adapt to changing engagement patterns
To measure success, we would track:
- Recovery of like rates toward previous baselines
- Engagement rates on new content formats
- Business satisfaction with page performance
- User satisfaction with Business Page content in their feeds
The primary risk with this approach is that we might over-optimize for the current algorithm, which could change again. To mitigate this, we should focus on principles of quality engagement rather than specific tactical workarounds.
Step 9
Decision Framework (3 minutes)
Based on our validation results, here's a decision framework for addressing the root cause:
| Condition | Action 1 | Action 2 |
|---|---|---|
| Algorithm change confirmed | Develop new content strategy guidelines for businesses | Launch educational campaign about effective engagement |
| Product/UI issues identified | Implement UI improvements to like functionality | Create alternative engagement pathways |
| User behavior shift confirmed | Develop new engagement features beyond likes | Shift business metrics focus to more relevant indicators |
| Technical bug discovered | Deploy fix immediately | Communicate transparently with affected businesses |
| Multiple factors contributing | Prioritize highest impact factor first | Develop comprehensive strategy addressing all factors |
This framework allows us to respond appropriately based on what our validation reveals, ensuring we address the actual root cause rather than symptoms.
For example, if we confirm the algorithm change hypothesis, we would focus on helping businesses adapt their content strategy to the new reality rather than trying to fight against the algorithm changes. Conversely, if we discover a technical issue, we would prioritize fixing that immediately.
The framework also accounts for the possibility that multiple factors are contributing simultaneously, in which case we would need a more comprehensive approach that addresses each factor according to its impact.
Step 10
Resolution Plan (2 minutes)
Immediate Actions (24-48 hours)
- Form a cross-functional task force including product, engineering, data science, and communications teams
- Implement monitoring to track like rates in real-time across different segments
- Communicate transparently with major business partners about the investigation
- Deploy quick technical fixes if any bugs are identified in the like functionality
Short-term Solutions (1-2 weeks)
- Develop and release content best practices guide for businesses based on current algorithm preferences
- Create dashboard for businesses to monitor their engagement metrics more effectively
- Launch limited tests of UI improvements to the like experience
- Provide businesses with alternative engagement strategies beyond likes
Long-term Prevention (1-3 months)
- Establish regular algorithm update briefings with Facebook to anticipate changes
- Develop more resilient engagement metrics that aren't solely dependent on likes
- Create an early warning system to detect significant metric shifts before they become problematic
- Build more robust business education resources about evolving social media engagement
This plan addresses not just the immediate issue but also builds resilience against future similar problems. By improving our understanding of algorithm changes, enhancing our metrics, and educating businesses, we can reduce vulnerability to sudden engagement shifts.
The resolution also considers implications for:
- Related features like comments and shares that may be similarly affected
- The broader ecosystem of business tools and analytics
- Long-term strategy for business engagement on the platform
.png)