
Introduction
To approach this product success metrics problem effectively, I'll follow a structured framework that covers core metrics, supporting indicators, and risk factors while considering all key stakeholders. Facebook Dating represents a significant expansion of Facebook's core value proposition, moving from social connectivity to romantic relationships. Determining the right success metrics requires understanding both the business objectives and user needs in this sensitive domain.
I'll follow a simple success metrics framework covering product context, success metrics hierarchy, and implementation considerations.
Step 1
Product Context
Facebook Dating is an opt-in feature within the Facebook app that allows users to create a separate dating profile and connect with potential romantic partners. It leverages Facebook's existing social graph while maintaining privacy between dating activities and regular Facebook usage.
Key Stakeholders:
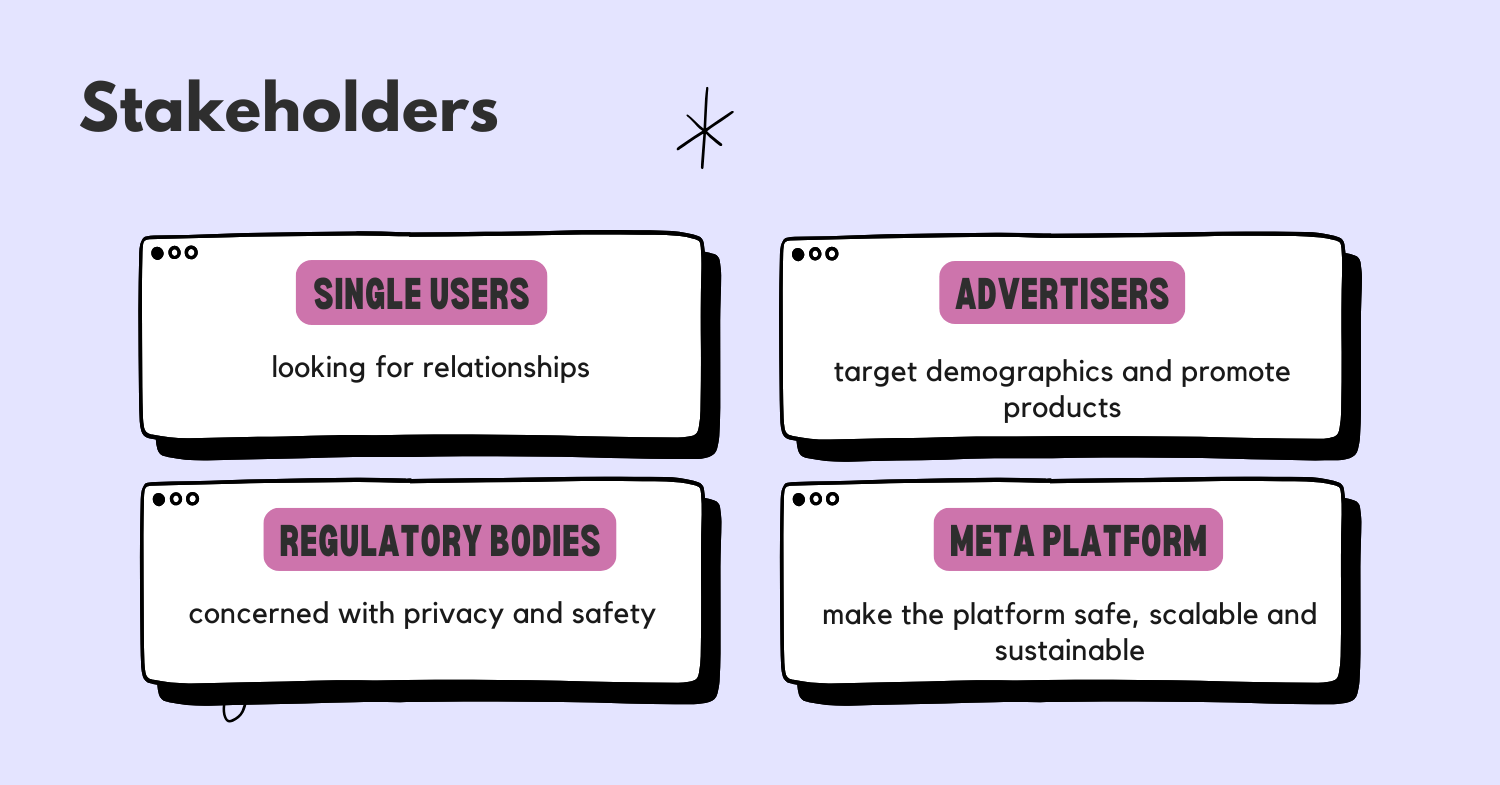
- Users: Singles looking for meaningful relationships
- Facebook: Seeking increased engagement and platform stickiness
- Advertisers: Interested in targeted advertising opportunities
- Investors: Looking for new growth vectors and revenue streams
- Regulators: Concerned with privacy, safety, and data usage
User Flow:
- Opt-in & Profile Creation: Users choose to join Dating and create a profile separate from their main Facebook profile, selecting photos and answering questions.
- Discovery: Users browse potential matches based on preferences, mutual friends, groups, and events, with the algorithm suggesting compatible profiles.
- Connection: Users express interest through likes or comments on profiles, with conversations beginning only after mutual interest is established.
- Conversation: Matched users communicate through a dedicated messaging system separate from Facebook Messenger.
- Relationship Development: Users may choose to meet in person or continue developing their relationship online.
Strategic Fit: Facebook Dating fits into Facebook's broader strategy of increasing user engagement and time spent on platform. It addresses the threat of users leaving for dedicated dating apps while leveraging Facebook's key advantage: deep knowledge of users' social connections, interests, and behaviors.
Competitive Landscape: Facebook Dating competes with established players like Tinder, Bumble, and Hinge, but differentiates through integration with Facebook's existing social graph and events. Unlike most competitors, it's not a standalone app but a feature within Facebook, potentially reducing friction for users already on the platform.
Product Lifecycle Stage: Facebook Dating is in the growth stage, having launched in select markets and expanded globally. It's past initial validation but still establishing market position and optimizing core features based on user feedback and engagement patterns.
Step 2
Goals
| Core Goals | User Goals | Technical Goals | Business Goals |
|---|---|---|---|
| Create meaningful romantic connections | Find compatible partners | Maintain privacy between dating and main Facebook | Increase user engagement on Facebook |
| Ensure user safety and privacy | Control visibility and exposure | Scale matching algorithms efficiently | Reduce churn to competing dating apps |
| Drive regular engagement | Have authentic conversations | Prevent abuse and fake profiles | Create new monetization opportunities |
| Facilitate relationship progression | Feel safe while dating | Optimize notification systems | Strengthen Facebook's ecosystem advantage |
Step 3
North Star Metric
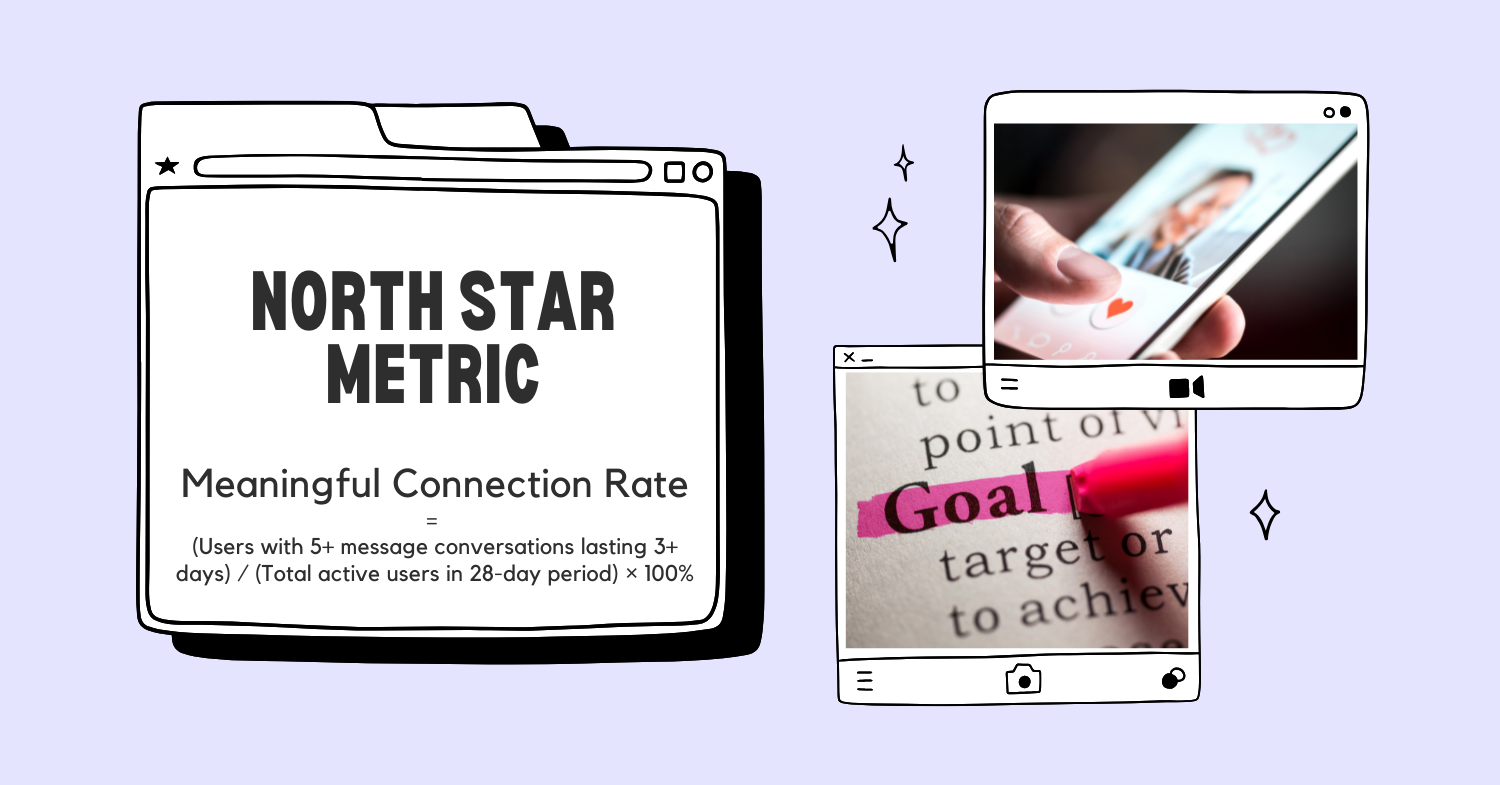
After careful consideration of Facebook Dating's purpose and stakeholder needs, I propose "Meaningful Connection Rate" as the North Star Metric.
Definition: The percentage of active users who establish at least one conversation that lasts 5+ messages and continues for more than 3 days within a 28-day period.
Calculation: Meaningful Connection Rate = (Users with 5+ message conversations lasting 3+ days) / (Total active users in 28-day period) × 100%
This metric captures the core value proposition of Facebook Dating: creating meaningful romantic connections. Unlike simple matching or messaging metrics, it focuses on quality interactions that have potential to develop into relationships.
Stakeholder Value Alignment:
- Users: Measures their success in finding engaging conversations with potential partners
- Facebook: Indicates platform stickiness and engagement depth
- Investors: Signals product-market fit and potential for long-term growth
- Safety Teams: Quality conversations correlate with positive user experiences
Hypothetical Data Example: If we see a Meaningful Connection Rate of 15% in Month 1, increasing to 18% in Month 2 and 22% in Month 3, this would indicate improving matching algorithms and user experience. Conversely, a declining trend might signal issues with match quality or conversation experience.
Breakdown of North Star Metric
The Meaningful Connection Rate can be broken down into component parts that help us understand the levers we can pull to improve it:
Formula Breakdown:
- Meaningful Connection Rate = f(Profile Quality, Match Rate, Conversation Depth)
- Profile Quality = f(Photos Uploaded, Bio Completion, Preference Specificity)
- Match Rate = f(Daily Active Users, Swipe Selectivity, Algorithm Effectiveness)
- Conversation Depth = f(Message Frequency, Conversation Duration, Response Rate)
This is generally the time to take your first 1-2 minutes break to organize your thoughts before diving into the next step.
Step 4
Supporting Metrics
| Metric | Importance | Calculation | Actions |
|---|---|---|---|
| Profile Completion Rate | Indicates user investment and provides better matching data | % of users who complete >80% of profile fields | Improve onboarding flow, add profile completion incentives, simplify input fields |
| Daily Active Users / Monthly Active Users (DAU/MAU) | Measures stickiness and regular engagement | DAU divided by MAU, expressed as % | Enhance notification strategy, improve discovery features, add new engagement hooks |
| Match Quality Score | Indicates algorithm effectiveness | Survey rating (1-10) of match quality after interactions | Refine matching algorithm, improve preference collection, increase data signals used |
| Conversation Initiation Rate | Measures user comfort in starting interactions | % of matches that lead to at least one message | Test conversation starters, improve UI for messaging, reduce friction points |
| 28-Day Retention | Indicates long-term value and habit formation | % of new users still active after 28 days | Improve early user experience, enhance notification strategy, optimize early match quality |
| Safety Report Rate | Monitors platform health and user safety | # of safety reports per 1,000 active users | Enhance profile verification, improve reporting tools, refine blocking mechanisms |
Step 5
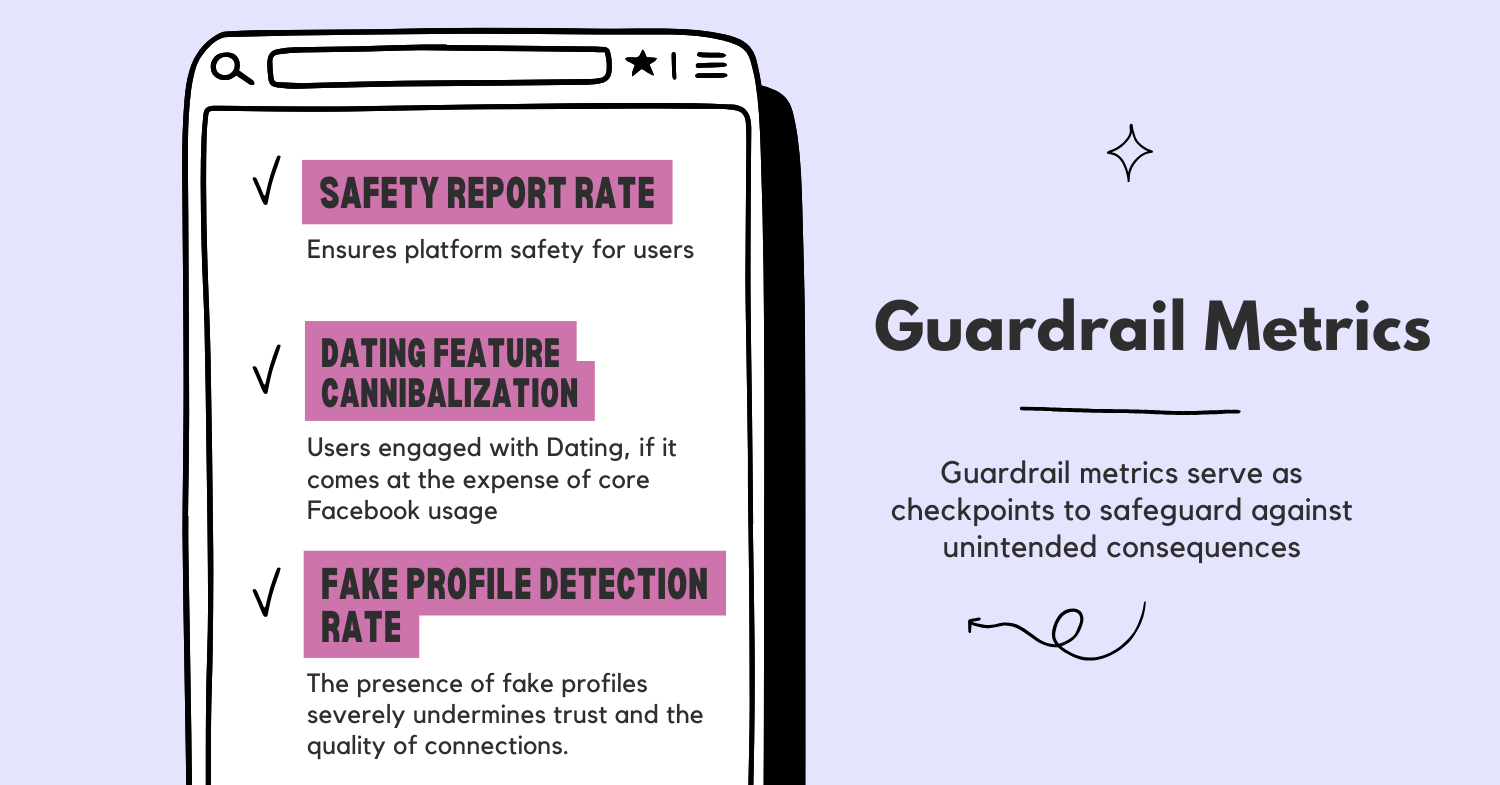
Guardrail Metrics
| Key Stakeholder | Metric | Why It Matters | Threshold |
|---|---|---|---|
| Users | Harassment Report Rate | Ensures platform remains safe and welcoming | <2% of active users reporting harassment monthly |
| Dating Feature Cannibalization | Ensures Dating doesn't reduce core Facebook usage | <5% reduction in core Facebook engagement for Dating users | |
| Trust & Safety | Fake Profile Detection Rate | Maintains authenticity and trust in the platform | >95% of fake profiles detected before user reports |
| Business | Cost Per Meaningful Connection | Ensures economic viability | <$5 per meaningful connection created |
Harassment Report Rate: This metric is critical because dating platforms inherently involve vulnerability. If this exceeds our threshold, it indicates our safety mechanisms are failing, which would quickly undermine trust in the platform and directly impact our North Star Metric as users withdraw from conversations or leave the platform entirely.
Dating Feature Cannibalization: While we want users engaged with Dating, if it comes at the expense of core Facebook usage, it could harm the overall business. This metric ensures Dating remains complementary to, rather than competitive with, the core Facebook experience. If users reduce their News Feed engagement significantly after joining Dating, we need to investigate whether Dating is creating a siloed experience.
Fake Profile Detection Rate: The presence of fake profiles severely undermines trust and the quality of connections. Our systems should proactively identify and remove fake profiles before they impact user experience. This directly supports our North Star by ensuring conversations are between authentic individuals.
Cost Per Meaningful Connection: This economic guardrail ensures we're creating value efficiently. If costs exceed our threshold, we need to optimize our matching algorithms, reduce promotional costs, or find other efficiencies to ensure Dating remains viable as a business initiative.
Step 6
Trade-off Metrics
1. Match Quantity vs. Match Quality
- Trade-off: Showing more potential matches increases options but may reduce the quality and relevance of each match.
- Metrics in Tension: "Average Daily Matches Shown" vs. "Match-to-Conversation Conversion Rate"
- Balancing Strategy: Implement progressive loading of matches with quality filters that adjust based on user behavior. Start with highest-quality matches and expand as needed, measuring the incremental conversion rate of each additional match cohort.
2. User Privacy vs. Match Relevance
- Trade-off: More data improves matching algorithms but raises privacy concerns.
- Metrics in Tension: "Data Points Used in Matching" vs. "Privacy Comfort Score" (from user surveys)
- Balancing Strategy: Implement tiered data usage with explicit opt-ins for advanced matching features. Create transparent explanations of how each data point improves match quality and measure the impact of each signal on successful connections.
3. Growth Speed vs. Community Health
- Trade-off: Rapid user acquisition may dilute community quality and safety.
- Metrics in Tension: "New User Growth Rate" vs. "Community Health Score" (composite of safety reports, fake profiles, etc.)
- Balancing Strategy: Implement progressive regional rollouts with health metrics as expansion gates. Scale trust and safety resources proportionally with user growth, and temporarily slow acquisition if health metrics decline.
4. Monetization vs. User Experience
- Trade-off: Aggressive monetization may harm the core dating experience.
- Metrics in Tension: "Revenue Per User" vs. "User Satisfaction Score"
- Balancing Strategy: Focus on indirect monetization (e.g., increased overall Facebook engagement) initially, then test direct monetization features with small user segments. Measure impact on core metrics before wider rollout.
Step 7
Counter Metrics
1. Ghost Rate
- Purpose: Measures the percentage of conversations that end abruptly (one person stops responding after 3+ exchanges)
- Prevention: High ghost rates may indicate poor match quality or conversation experience
- Actions if Problematic: Improve matching algorithms, introduce conversation prompts, or implement gentle reminders for inactive conversations
2. Dating-to-Facebook Sentiment Differential
- Purpose: Measures difference in user sentiment between Dating experience and overall Facebook experience
- Prevention: Ensures Dating doesn't become a negative outlier within Facebook's ecosystem
- Actions if Problematic: Investigate specific friction points, improve integration with core Facebook experience, or adjust expectations during onboarding
3. Reported Outcomes Ratio
- Purpose: Tracks ratio of negative reports (harassment, misrepresentation) to positive outcomes (relationships formed, dates arranged)
- Prevention: Ensures focus on meaningful connections doesn't come at expense of user safety
- Actions if Problematic: Strengthen verification processes, enhance moderation systems, or adjust matching algorithms to prioritize safety signals
Strategic Initiatives
Based on the metrics framework, I would propose these strategic initiatives:
1. Connection Quality Enhancement Program
- Rationale: Directly improves our North Star Metric by focusing on conversation quality
- Components:
- AI-powered conversation starters based on shared interests
- Gentle nudges for conversation revival after 24 hours of inactivity
- Post-conversation feedback loop to improve matching algorithm
- Expected Impact: 15-20% increase in Meaningful Connection Rate within 3 months
- Implementation Challenges: Balancing helpful suggestions without feeling intrusive
2. Integrated Dating Journey
- Rationale: Leverages Facebook's unique advantage of social context while maintaining privacy
- Components:
- Opt-in shared events discovery for matches
- Interest-based group suggestions for dating users
- Safe, controlled ways to transition from Dating to Facebook friendship
- Expected Impact: 25% increase in relationship formation rate, 10% reduction in platform churn
- Implementation Challenges: Maintaining strict privacy boundaries while enabling natural relationship progression
3. Trust Amplification System
- Rationale: Addresses safety concerns that may limit engagement depth
- Components:
- Enhanced verification options (without requiring additional personal data)
- Community reputation system based on interaction quality
- Transparent safety metrics dashboard for users
- Expected Impact: 30% reduction in safety reports, 15% increase in conversation depth
- Implementation Challenges: Building effective verification without creating onboarding friction
Conclusion
Facebook Dating's success ultimately depends on creating meaningful romantic connections while maintaining user safety and privacy. The Meaningful Connection Rate provides a holistic view of how well we're delivering on this core value proposition.
As the product evolves, we should consider how emerging technologies might impact our metrics approach. For example, AI could enable more sophisticated conversation analysis to better understand relationship quality beyond simple message counts. Similarly, as virtual and augmented reality become more mainstream, we may need to develop new metrics for immersive dating experiences.
The dating landscape continues to evolve rapidly, with changing social norms around online relationships and increasing expectations for authenticity. Our metrics framework should evolve accordingly, potentially incorporating more qualitative measures of relationship satisfaction and long-term outcomes as the product matures.
.png)