
Introduction
Setting effective goals for Uber Eats is crucial for driving growth and ensuring customer satisfaction in the competitive food delivery market. To approach this product success metrics problem effectively, I'll follow a structured framework that covers core metrics, supporting indicators, and risk factors while considering all key stakeholders.
I'll follow a simple success metrics framework covering product context, success metrics hierarchy.
Step 1
Product Context
Uber Eats operates in the highly competitive food delivery marketplace, connecting three key stakeholders: customers seeking convenient food options, restaurant partners looking to expand their reach, and delivery partners seeking flexible income opportunities. The core product enables users to browse nearby restaurants, place orders, track delivery in real-time, and receive their food with minimal friction.
The typical user flow involves:
- Opening the app and browsing restaurants based on location, cuisine preferences, and delivery time
- Selecting items, customizing orders, and proceeding to checkout
- Tracking order status from preparation through delivery
- Receiving food and potentially providing ratings/feedback
For Uber, Eats represents a strategic diversification beyond ridesharing, leveraging their existing logistics expertise and driver network while creating new revenue streams. The service competes directly with DoorDash, Grubhub, and regional players, with differentiation primarily through restaurant selection, delivery speed, and integration with the broader Uber ecosystem.
From a lifecycle perspective, Uber Eats has moved beyond initial growth stages into a maturity phase in established markets, while still expanding in emerging regions. This requires balancing growth initiatives with profitability and retention strategies.
Step 2
Goals
| Core Goals | User Goals | Technical Goals | Business Goals |
|---|---|---|---|
| Increase marketplace efficiency | Customers: Fast, reliable food delivery | Platform stability and uptime | Achieve profitability in mature markets |
| Grow active users across all segments | Restaurants: Incremental revenue | Scalable infrastructure | Expand market share in key regions |
| Improve unit economics | Delivery partners: Maximize earnings | Optimize routing algorithms | Increase shareholder value |
| Enhance customer retention | All: Intuitive, frictionless experience | Reduce technical debt | Drive synergies with Uber's core business |
Step 3
North Star Metric
 For Uber Eats, I propose Monthly Active Platform Consumers (MAPCs) with Positive Contribution Margin as our North Star Metric. This metric captures both growth and sustainability by measuring the number of users who are actively engaging with the platform while generating positive unit economics.
This NSM is powerful because it:
- Focuses on active usage rather than just acquisition
- Incorporates financial health through the contribution margin filter
- Aligns with Uber's broader corporate metrics
- Balances growth with sustainability
All stakeholders benefit from this metric: customers get better service as we optimize for retention, restaurants see more consistent orders from repeat customers, delivery partners get more consistent work, and the business moves toward profitability.
Looking at hypothetical data, we might see:
- Q1: 15M MAPCs with 40% positive contribution margin
- Q2: 16M MAPCs with 45% positive contribution margin
- Q3: 17.5M MAPCs with 48% positive contribution margin
This trend would indicate both healthy user growth and improving unit economics, suggesting our strategies are working effectively.
Breakdown North Star Metric
Our North Star Metric can be broken down into its component parts:
The formula breakdown:
- NSM = MAPCs × % with Positive Contribution Margin
- MAPCs = New Users + Retained Users
- % with Positive Contribution Margin = Users where (Revenue per User > Cost per User) ÷ Total MAPCs
- Revenue per User = Order Frequency × Average Order Value × Take Rate
- Cost per User = Delivery Costs + Support Costs + Marketing Costs
Step 4
Supporting Metrics
| Metric | Importance | Calculation | Actions |
|---|---|---|---|
| Order Frequency | Drives revenue and engagement | Orders per active user per month | Implement personalized recommendations, loyalty programs, subscription offerings |
| Restaurant Selection Rate | Measures marketplace health | % of searches resulting in restaurant selection | Improve search algorithms, expand restaurant partnerships in underserved areas |
| Delivery Time Accuracy | Critical for customer satisfaction | Actual delivery time vs. estimated time | Refine time prediction models, optimize courier routing, improve restaurant preparation estimates |
| Courier Utilization | Affects unit economics | % of courier time spent on deliveries vs. waiting | Improve batching algorithms, adjust incentives during peak/off-peak hours |
| Restaurant Retention | Platform stability | % of restaurants active after 3/6/12 months | Enhance restaurant tools, improve economics, provide business insights |
Step 5
Guardrail Metrics
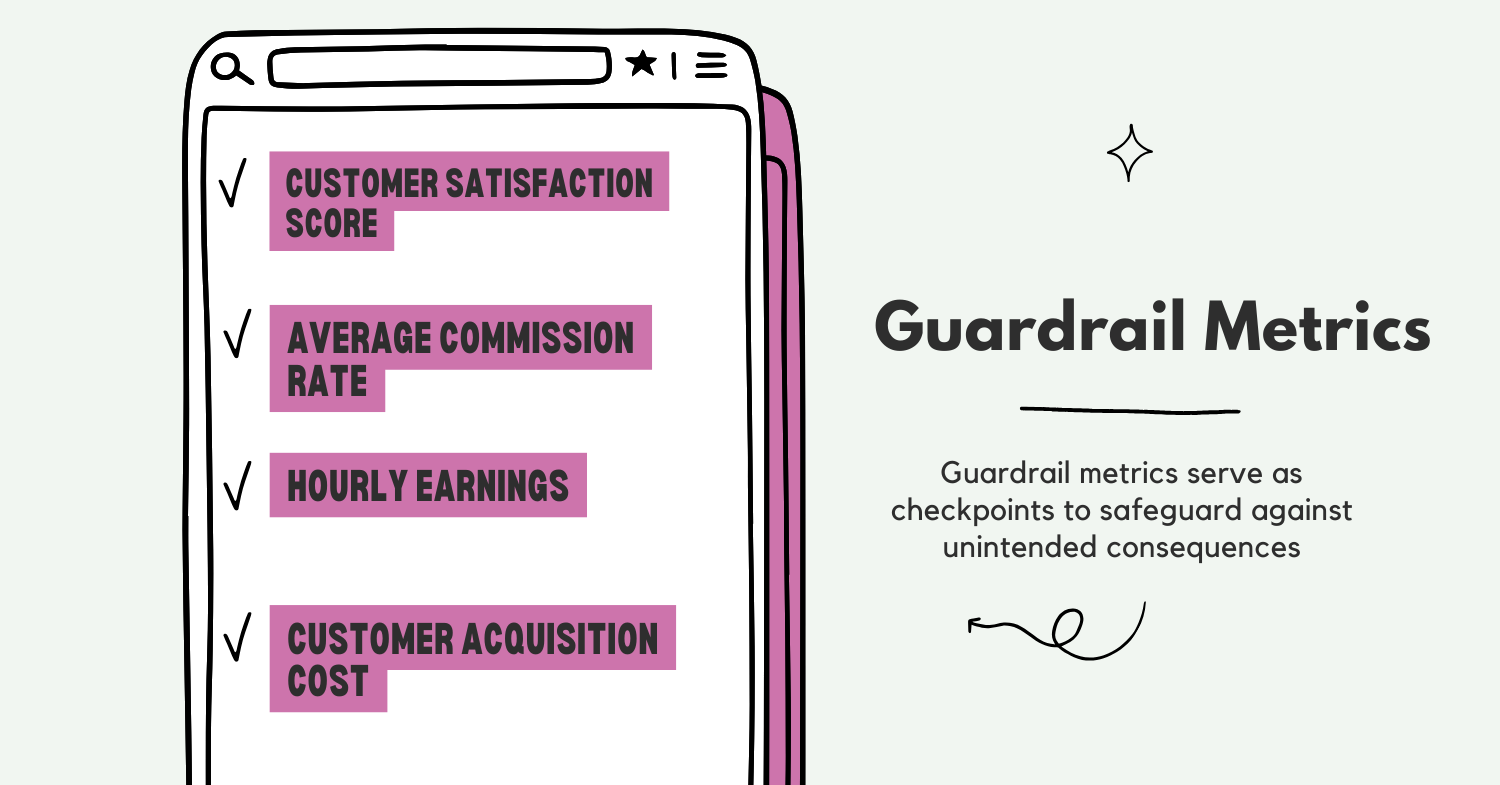
| Key Stakeholder | Metric | Why It Matters | Threshold |
|---|---|---|---|
| Customers | Customer Satisfaction Score | Ensures we're not growing at expense of experience | Minimum 4.2/5 |
| Restaurants | Average Commission Rate | Prevents unsustainable economics for partners | Maximum 30% |
| Delivery Partners | Hourly Earnings | Ensures sufficient courier supply | Minimum 1.2× local minimum wage |
| Business | Customer Acquisition Cost | Maintains sustainable growth economics | Maximum 12-month LTV/3 |
Each guardrail metric serves as a check against optimizing our North Star at the expense of stakeholder health. For example, we could temporarily boost MAPCs by slashing delivery fees, but this would violate our CAC guardrail and hurt unit economics. Similarly, we could improve contribution margin by raising restaurant commissions, but this would breach our commission rate guardrail and risk restaurant churn.
Step 6
Trade-off Metrics
-
Selection vs. Delivery Time
- Trade-off: Broader restaurant selection increases customer choice but can extend delivery radius and times
- Balancing strategy: Implement dynamic delivery radiuses based on demand patterns and courier availability; highlight estimated delivery times prominently in the selection process
-
Take Rate vs. Restaurant Growth
- Trade-off: Higher commissions improve unit economics but can limit restaurant participation
- Balancing strategy: Tiered commission structure based on volume; value-added services for restaurants to justify higher rates
-
Courier Earnings vs. Delivery Costs
- Trade-off: Higher courier pay improves supply but increases delivery costs
- Balancing strategy: Dynamic incentives during peak periods; batch ordering to improve efficiency; optimize routing to increase deliveries per hour
-
Marketing Spend vs. Contribution Margin
- Trade-off: Higher acquisition spending drives growth but hurts near-term unit economics
- Balancing strategy: Focus on retention marketing for existing users; targeted acquisition in high-LTV segments; seasonal adjustment of spend based on natural demand patterns
Step 7
Counter Metrics
-
Ghost Kitchen Percentage
- Purpose: Monitors the proportion of orders coming from virtual restaurants with no physical storefront
- Potential pitfall: Over-reliance on ghost kitchens could commoditize the platform and reduce differentiation
- Action threshold: If exceeding 30% of orders, evaluate impact on customer perception and marketplace diversity
-
Subscription Cannibalization Rate
- Purpose: Measures how much subscription program (Uber Eats Pass) reduces per-order margins
- Potential pitfall: High subscription adoption without corresponding increase in order frequency could hurt economics
- Action threshold: If margin reduction exceeds frequency increase by >15%, reevaluate subscription pricing and benefits
-
Peak Hour Fulfillment Rate
- Purpose: Tracks our ability to meet demand during highest-volume periods
- Potential pitfall: Strong average metrics might mask critical failures during peak times
- Action threshold: If falling below 92%, implement targeted courier incentives and restaurant capacity management
Strategic Initiatives
Based on these metrics, I would prioritize three strategic initiatives:
-
Courier Efficiency Program
- Rationale: Delivery costs represent our largest variable expense
- Implementation: Enhanced batching algorithms, predictive positioning, and multi-pickup optimization
- Expected impact: 15% improvement in deliveries per hour, directly improving contribution margin
-
Restaurant Success Platform
- Rationale: Restaurant retention drives selection and customer satisfaction
- Implementation: Enhanced analytics dashboard, menu optimization tools, and demand forecasting
- Expected impact: 20% reduction in restaurant churn, improving selection and customer retention
-
Personalized Engagement Engine
- Rationale: Increasing order frequency from existing customers has the highest ROI
- Implementation: ML-driven recommendations, personalized promotions, and reengagement campaigns
- Expected impact: 10% increase in monthly order frequency among existing users
Conclusion
As we look ahead, several trends will impact how we measure success for Uber Eats:
- The rise of quick commerce and ultra-fast delivery will compress expected delivery windows
- Integration of food delivery with other services (groceries, alcohol, retail) will require more sophisticated cross-category metrics
- Autonomous delivery technologies may fundamentally reshape the unit economics model
Our metrics framework will need to evolve accordingly, potentially incorporating new dimensions like sustainability metrics and deeper integration with the broader Uber ecosystem.
.png)