
To approach this retention metrics problem effectively, I will follow a simple product success metric framework. I'll follow a structured framework that covers core metrics, supporting indicators, and risk factors while considering all key stakeholders.
I'll follow a simple success metrics framework covering product context, success metrics hierarchy.
Step 1
Product Context
Instagram Stories is a feature that allows users to share photos and videos that disappear after 24 hours. Launched in 2016 as a direct response to Snapchat, Stories has become a core part of the Instagram experience and a significant driver of engagement on the platform.
Key Stakeholders and Motivations
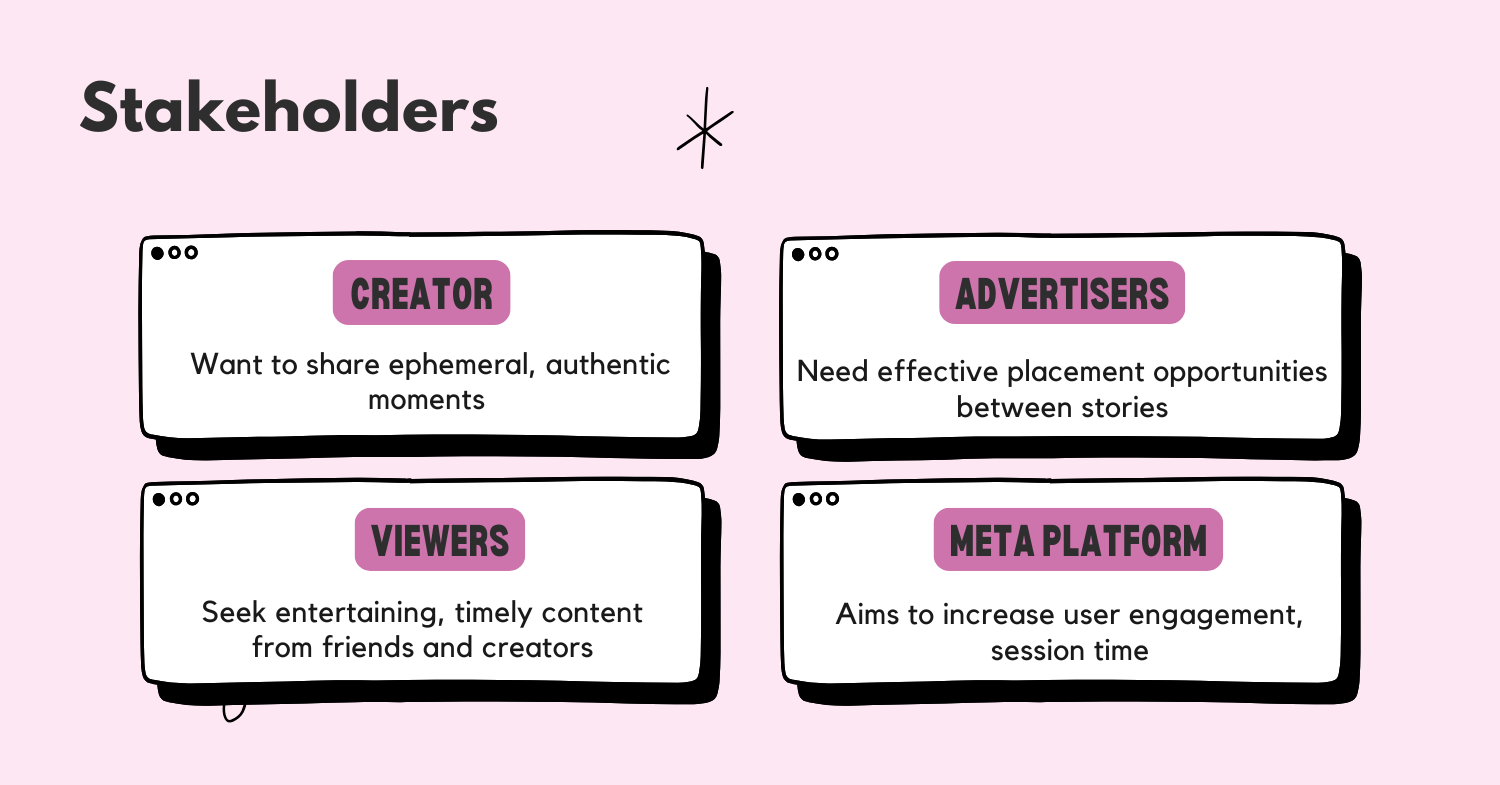
- Users (Creators): Want to share ephemeral, authentic moments without cluttering their permanent profile
- Users (Viewers): Seek entertaining, timely content from friends and creators they follow
- Advertisers: Need effective placement opportunities between stories to reach target audiences
- Instagram/Meta: Aims to increase user engagement, session time, and ad revenue
- Content Creators/Influencers: Use stories to maintain daily connection with followers
User Flow
Users access Stories through tapping profile bubbles at the top of their Instagram feed. They view content through a linear, auto-advancing format, swiping to skip or tapping to pause. For creation, users capture or upload content, add creative elements (stickers, text, filters), and publish to their story, optionally restricting visibility to close friends or hiding from specific users.
Strategic Fit
Stories fits into Meta's broader strategy of capturing more user attention and time spent in-app. It creates additional advertising inventory and helps Instagram compete against other social platforms. The feature encourages frequent, casual sharing that complements the more curated main feed posts.
Competitive Landscape
While Instagram Stories was inspired by Snapchat, it has surpassed its competitor in usage. TikTok has emerged as the primary competitor for short-form video attention, though with a different format. YouTube Shorts and Twitter Fleets (discontinued) have attempted similar features with varying success.
Product Lifecycle Stage
Instagram Stories is in the maturity phase of its lifecycle. The core functionality is well-established, with incremental innovations focusing on new creative tools, shopping integrations, and improved ad experiences rather than fundamental changes to the format.
Step 2
Goals
| Core Goals | User Goals | Technical Goals | Business Goals |
|---|---|---|---|
| Drive daily active engagement | Share ephemeral moments easily | Maintain reliable delivery at scale | Increase time spent in app |
| Increase content creation | Discover timely content from connections | Optimize video loading/playback | Generate ad revenue |
| Foster authentic sharing | Express creativity through tools/features | Support new creative features | Compete with rival platforms |
| Build habit-forming loops | Stay updated on friends' activities | Minimize storage requirements | Gather user behavior data |
Step 3
North Star Metric
 For Instagram Stories, I propose Weekly Active Stories Users (WASU) as the North Star Metric. This measures the number of unique users who either create or view at least one story in a 7-day period.
Definition: Count of unique users who have either created or viewed at least one story in the past 7 days.
Calculation: WASU = Count of unique users who created OR viewed stories in past 7 days
This metric captures success because:
- It measures both creation and consumption, the two critical behaviors for Stories
- Weekly cadence balances daily fluctuations while maintaining recency
- It's sensitive to both acquisition and retention issues
- It correlates directly with advertising inventory and revenue potential
All stakeholders derive value from this metric:
- Users: Higher WASU indicates compelling content worth returning for
- Advertisers: More active users mean greater reach potential
- Instagram/Meta: Directly ties to engagement and revenue goals
- Content Creators: Larger active audience for their content
Hypothetical Data Example: If WASU is 500M in January and grows to 520M by March but then declines to 510M in April, this might indicate seasonal effects or a feature change that negatively impacted engagement. A consistent downward trend would signal a more serious retention problem requiring immediate investigation.
Breakdown North Star Metric
WASU can be broken down into its component parts to better understand what drives changes:
WASU = f(Creator_Count, Viewer_Count) Creator_Count = f(New_Creators, Retained_Creators) Viewer_Count = f(New_Viewers, Retained_Viewers) Retained_Creators = f(Creation_Ease, Audience_Feedback) Retained_Viewers = f(Content_Quality, Discovery_Effectiveness)
This is generally the time to take your first 1-2 minutes break to organize your thoughts before diving into the next step.
Step 4
Supporting Metrics
| Metric | Importance | Calculation | Actions |
|---|---|---|---|
| D1/D7/D30 Retention | Measures short, medium, and long-term retention across different user cohorts | % of new users who return on day 1, 7, and 30 after first using Stories | Improve onboarding, implement re-engagement campaigns, analyze drop-off points |
| Stories Completion Rate | Indicates content quality and user interest | % of stories viewed to completion without skipping | Improve content ranking algorithms, provide creator insights on optimal story length |
| Stories Creation Frequency | Measures creator engagement and content supply | Average number of stories created per creator per week | Simplify creation flow, add new creative tools, send creation reminders |
| Time Spent Watching Stories | Captures depth of engagement | Average minutes per user per day spent watching stories | Improve content relevance, optimize autoplay experience, enhance discovery |
| Stories Reply Rate | Measures interactive engagement | % of viewed stories that receive a direct reply | Improve reply UI, highlight engaging content, create reply prompts |
| L28 Retention | Captures monthly habit formation | % of users active in previous month who remain active in current month | Identify churning segments, create re-engagement hooks, improve core experience |
Step 5
Guardrail Metrics
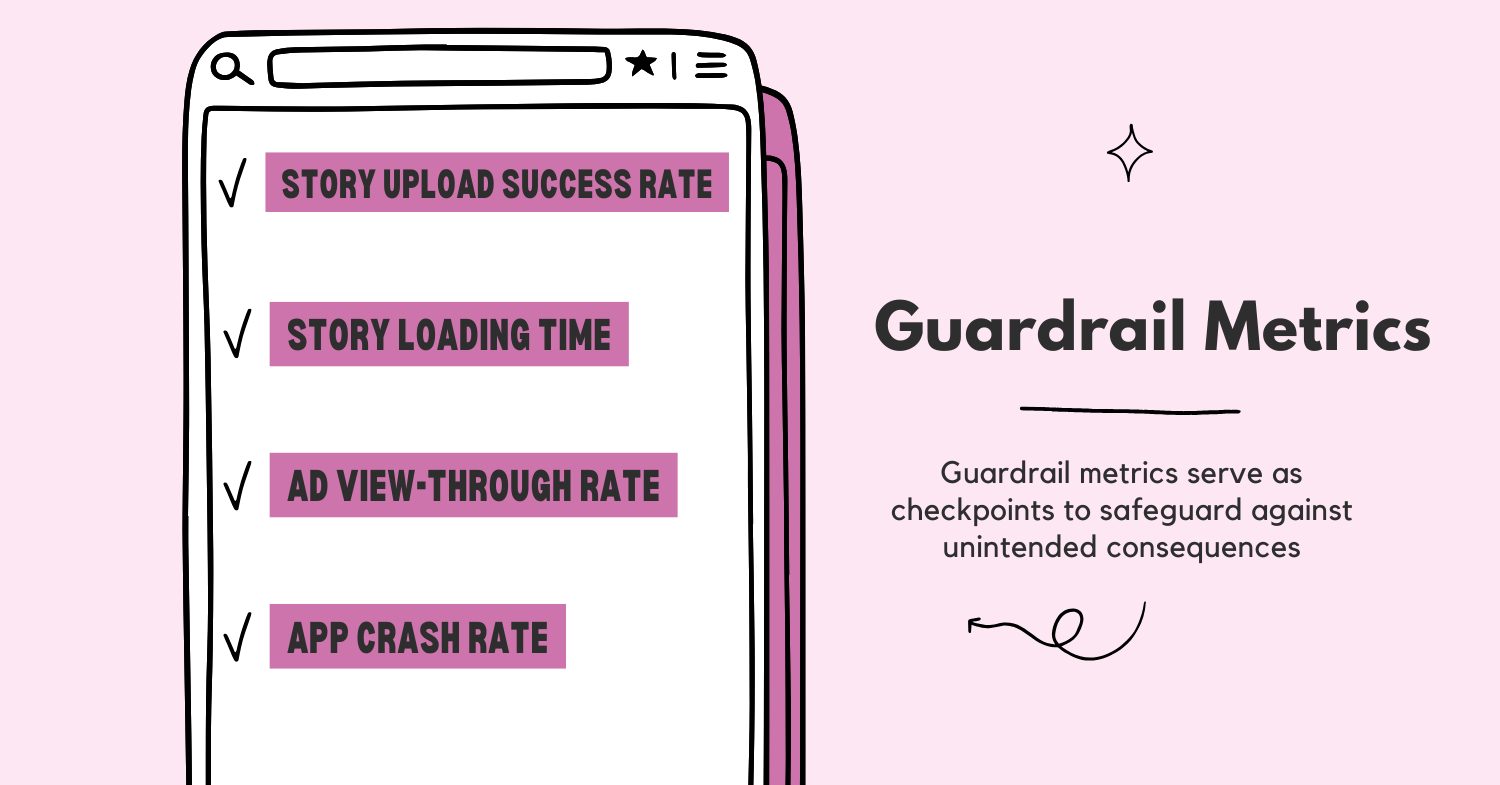
| Key Stakeholder | Metric | Why It Matters | Threshold |
|---|---|---|---|
| Users (Creators) | Story Upload Success Rate | Failed uploads lead to frustration and abandonment | >99.5% success |
| Users (Viewers) | Story Loading Time | Slow loading causes abandonment and poor experience | <2 seconds average |
| Advertisers | Ad View-Through Rate | Measures ad effectiveness and revenue potential | >85% |
| Instagram/Meta | App Crash Rate After Story Interaction | Technical stability impacts overall retention | <0.5% |
| Content Creators | Story Reach (% of followers) | Critical for creator satisfaction and continued usage | >15% average |
Story Upload Success Rate: This metric ensures creators can reliably share content. If this drops below threshold, it directly impacts our North Star by reducing creator retention. Technical teams should prioritize upload reliability over new features when this metric is at risk.
Story Loading Time: Slow-loading stories create friction in the viewing experience, leading to session abandonment. This metric correlates strongly with viewer retention, a key component of our WASU. Performance optimizations should be prioritized when this metric trends upward.
Ad View-Through Rate: While not directly a retention metric, ad performance impacts the business model that supports Stories. If users are skipping ads at high rates, it threatens revenue while potentially indicating content relevance issues that could impact retention.
App Crash Rate: Technical stability is a fundamental requirement for retention. Crashes during Story viewing or creation create negative experiences that can drive users to competing platforms. This metric serves as an early warning system for technical issues that could impact retention.
Story Reach: For creators, particularly influencers and businesses, reach is a critical metric that determines their continued investment in the platform. Declining reach can lead to creator abandonment, reducing content supply and ultimately impacting viewer retention.
Step 6
Trade-off Metrics
1. Story Ad Frequency vs. User Session Length
- Trade-off: Increasing ad frequency generates more revenue but may reduce user engagement time
- Balancing Strategy: Implement dynamic ad loading based on user engagement patterns; highly engaged users can receive more ads without significant retention impact, while at-risk users see fewer ads to prioritize experience
2. Creator Retention vs. Viewer Retention
- Trade-off: Features optimized for creators (more tools, analytics) may come at the expense of viewer experience (longer loading times, complex UI)
- Balancing Strategy: Segment features by user type; offer advanced tools for power creators while maintaining a clean viewing experience; use A/B testing to ensure new creator features don't negatively impact viewer metrics
3. Content Freshness vs. Content Relevance
- Trade-off: Prioritizing recent content ensures timeliness but may show less relevant content to users
- Balancing Strategy: Implement a hybrid ranking algorithm that weights both recency and predicted relevance; monitor completion rates as a signal for proper balance
4. Close Friends Usage vs. Broad Sharing
- Trade-off: Encouraging Close Friends usage may increase intimate sharing but reduce overall content availability
- Balancing Strategy: Promote Close Friends as an additional sharing option rather than a replacement; measure the incremental stories created through this feature rather than focusing on distribution metrics
Step 7
Counter Metrics
1. Content Diversity Metric
- Purpose: Ensures users are seeing stories from a diverse set of creators, not just the most popular accounts
- Avoiding Pitfalls: Prevents engagement concentration that could make the platform vulnerable if top creators leave
- Action Plan: If diversity drops below threshold, adjust the ranking algorithm to surface content from a wider range of creators
2. Creation Abandonment Rate
- Purpose: Measures % of users who begin creating a story but abandon before publishing
- Avoiding Pitfalls: High abandonment indicates friction in the creation process that could lead to creator churn
- Action Plan: If rising above 20%, conduct user research to identify pain points in the creation flow and prioritize fixes
3. Passive Consumption Ratio
- Purpose: Tracks the ratio of users who only view stories vs. those who also create
- Avoiding Pitfalls: A platform with too many passive consumers risks content supply issues
- Action Plan: If ratio exceeds 5:1, implement targeted prompts to encourage creation among viewers
Strategic Initiatives
Based on the retention metrics framework outlined above, I would propose these strategic initiatives:
1. Stories Creation Assistant
- Rationale: Addressing creation abandonment by simplifying the story creation process
- Impact: Should improve creator retention, increase content supply, and potentially convert passive viewers to creators
- Implementation Challenges: Balancing simplicity with creative freedom; ensuring the assistant doesn't make content feel templated or inauthentic
2. Personalized Re-engagement Program
- Rationale: Target users showing early signs of disengagement with personalized content highlights
- Impact: Improve D7 and D30 retention rates by bringing back users before they fully churn
- Implementation Challenges: Requires sophisticated prediction models; risk of notification fatigue; privacy considerations
3. Interactive Stories Format Expansion
- Rationale: Increase engagement depth through new interactive elements (polls, questions, etc.)
- Impact: Improve completion rates, time spent, and reply rates by making viewing more active
- Implementation Challenges: Maintaining simplicity; ensuring new formats work across devices; educating users on new capabilities
Conclusion
Instagram Stories retention metrics must evolve as the product matures and user behaviors shift. As AR/VR technologies advance, we may need to develop new engagement metrics that capture immersive experiences. The rise of short-form video competitors may require us to focus more on cross-format retention within the Instagram ecosystem rather than Stories in isolation.
The metrics framework I've outlined provides a comprehensive view of Stories retention while acknowledging the complex interplay between creation, consumption, and monetization. By focusing on Weekly Active Stories Users as our North Star while monitoring supporting and counter metrics, we can ensure sustainable growth while maintaining a healthy ecosystem for all stakeholders.
.png)