
Introduction
To approach this Instagram Shopping metrics problem effectively, I will follow a simple product success metric framework. I'll follow a structured framework that covers core metrics, supporting indicators, and risk factors while considering all key stakeholders - from shoppers and creators to brands and Instagram's business interests.
Step 1
Product Context
Instagram Shopping transforms the platform from a pure social/content experience into a commerce destination. It allows users to discover, browse, and purchase products directly within Instagram through features like product tags in posts/stories, the Shop tab, and checkout functionality.
Key Stakeholders:
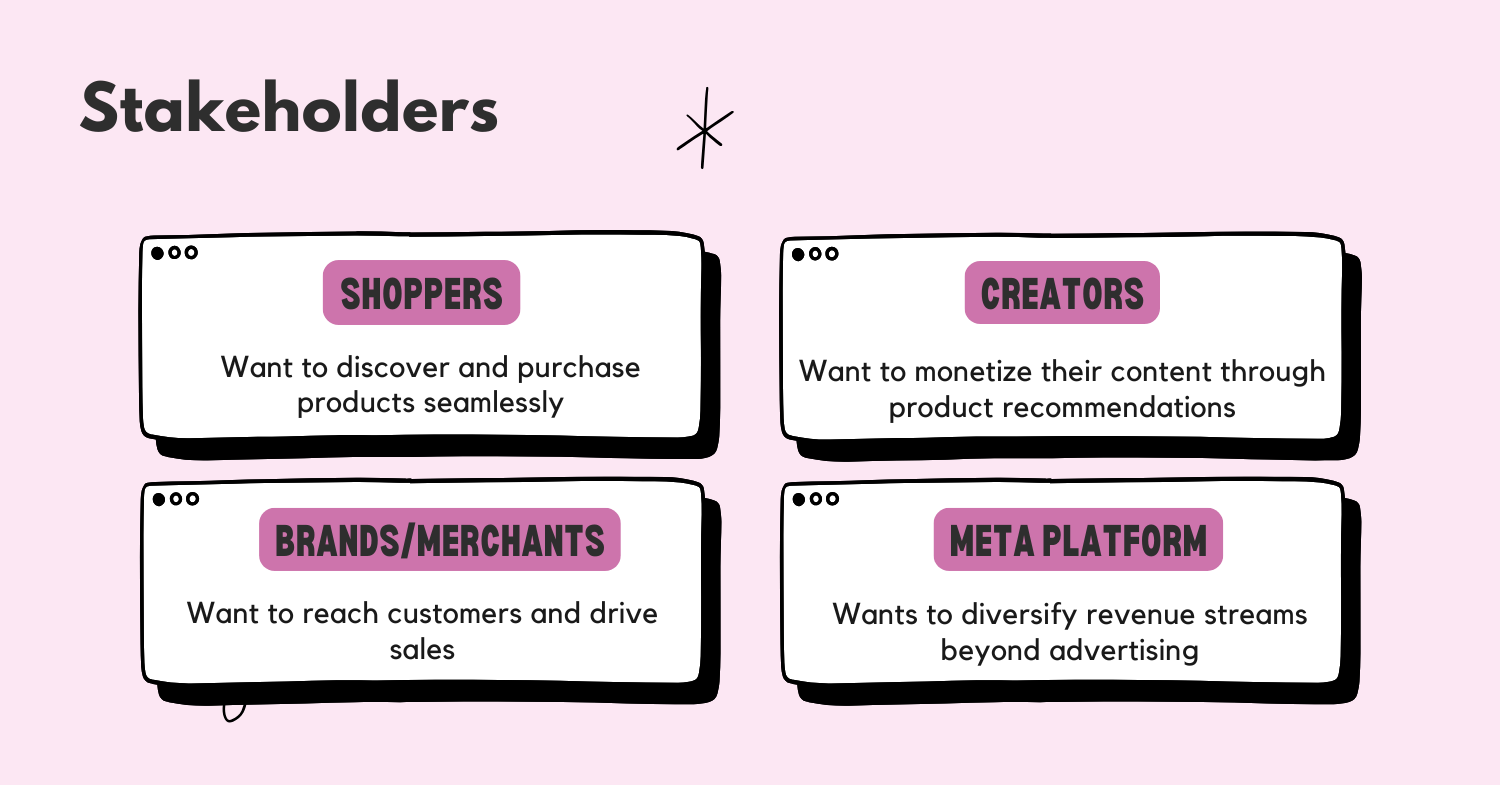
- Shoppers: Want to discover and purchase products seamlessly
- Creators: Want to monetize their content through product recommendations
- Brands/Merchants: Want to reach customers and drive sales
- Instagram/Meta: Wants to diversify revenue streams beyond advertising
User Flow:
- Discovery: Users encounter shoppable posts in feed, explore, or dedicated shop tab
- Consideration: Users tap product tags to view details, pricing, and variants
- Purchase: Users complete checkout within Instagram or are directed to merchant site
- Post-purchase: Users receive order confirmations and can track/manage purchases
Instagram Shopping fits into Meta's broader strategy of diversifying revenue streams beyond advertising while keeping users within the ecosystem longer. It also helps Meta collect valuable purchase intent and conversion data that strengthens their ad targeting capabilities.
Competitive Landscape: Instagram Shopping competes directly with TikTok Shop, Pinterest Shopping, and Snapchat's commerce features. Each platform leverages its unique content format and user base, with Instagram's advantage being its visual nature and established creator economy.
Product Lifecycle Stage: Instagram Shopping is in the growth phase, having moved beyond initial launch but not yet reaching maturity. The feature has established product-market fit but continues to expand functionality and merchant adoption while optimizing conversion rates.
Step 2
Goals
| Core Goals | User Goals | Technical Goals | Business Goals |
|---|---|---|---|
| Drive commerce transactions within Instagram | Discover relevant products seamlessly | Maintain app performance despite added shopping features | Diversify revenue beyond advertising |
| Increase time spent in shopping experiences | Complete purchases with minimal friction | Ensure secure payment processing | Increase merchant adoption and retention |
| Build a sustainable shopping ecosystem | Save products for future consideration | Scale to support global commerce | Capture valuable purchase intent data |
| Connect creators with monetization opportunities | Follow favorite brands and creators | Integrate with various merchant systems | Strengthen competitive position against TikTok, Pinterest |
Step 3
North Star Metric
 Now that Instagram has already launched native shops and payment gateways. I believe, the North Star Metric should be Gross Merchandise Value (GMV).
Definition: Total monetary value of all merchandise sold through Instagram Shopping over a specific time period.
Calculation: Sum of (Price × Quantity) for all items purchased through Instagram Shopping, whether via checkout on Instagram or through attributed clicks to merchant sites.
GMV is the ideal North Star Metric because it directly measures the economic value created by the shopping feature. It aligns all stakeholders:
- Shoppers get value when they find and purchase products they want
- Creators earn more when their content drives purchases
- Merchants care primarily about sales volume
- Instagram/Meta generates revenue through transaction fees and increased ad spend from successful merchants
Hypothetical Data Example: If monthly GMV is $500M and growing at 15% month-over-month, this indicates strong product-market fit and adoption. If growth slows to 5% or becomes flat, it might indicate market saturation, competitive pressure, or seasonal effects that require investigation.
Breakdown North Star Metric
GMV can be broken down using the following formula: GMV = Number of Purchasers × Average Order Value
GMV = f(Purchasers, AOV) Purchasers = f(MAU, Conversion Rate) Conversion Rate = f(Product View Rate, Cart Completion Rate) AOV = f(Items per Order, Average Item Price)
This is generally the time to take your first 1-2 minutes break to organize your thoughts before diving into the next step.
Step 4
Supporting Metrics
| Metric | Importance | Calculation | Actions |
|---|---|---|---|
| Conversion Rate | Measures effectiveness of the shopping funnel | Purchases / Shopping Sessions | Improve product detail pages, simplify checkout, add social proof |
| Average Order Value (AOV) | Indicates purchase behavior and economic value per transaction | Total Revenue / Number of Orders | Implement product recommendations, bundles, free shipping thresholds |
| Shopping Engagement Rate | Shows how effectively we're integrating shopping into core Instagram experience | (Product Taps + Shop Tab Opens) / DAU | Improve product tag visibility, enhance shop tab curation, optimize shopping-related notifications |
| Merchant Retention | Measures sustainability of the seller ecosystem | % of merchants active in current month who were also active previous month | Improve seller tools, reduce fees for high performers, provide marketing insights |
| Creator Shopping Adoption | Indicates health of the creator commerce ecosystem | % of eligible creators who have tagged products in last 28 days | Improve creator tools, increase revenue share, showcase success stories |
Step 5
Guardrail Metrics

| Key Stakeholder | Metric | Why It Matters | Threshold |
|---|---|---|---|
| Users | Core Instagram Engagement (Time spent on non-shopping content) | Ensures shopping doesn't detract from core social experience | No more than 5% decrease quarter-over-quarter |
| Merchants | Return Rate | Indicates product quality and description accuracy | Below 15% of total orders |
| Instagram/Meta | App Store Rating | Reflects overall user satisfaction | Maintain above 4.5 stars |
| Shoppers | Customer Satisfaction Score | Measures quality of shopping experience | Above 85% satisfaction |
Core Instagram Engagement: If this drops significantly, it could indicate that shopping features are disrupting the core social experience that brings users to Instagram in the first place. This would ultimately hurt our GMV as fewer users would mean fewer potential shoppers.
Return Rate: High return rates indicate poor merchant quality or misleading product descriptions, which damages user trust in Instagram Shopping as a whole. This directly impacts repeat purchase behavior and GMV.
App Store Rating: A declining app rating often signals broader user dissatisfaction that could eventually impact shopping engagement and conversion rates.
Customer Satisfaction: Direct feedback from shoppers helps identify friction points that quantitative metrics might miss. Low satisfaction scores are leading indicators of future GMV challenges.
Step 6
Trade-off Metrics
1. Shopping Prominence vs. Social Engagement
- Trade-off: Increasing shopping features' visibility may drive more GMV but could reduce core social engagement
- Balancing Strategy: A/B test different levels of shopping integration, segment users based on shopping propensity, and personalize the balance of shopping vs. social content
2. Merchant Quantity vs. Quality
- Trade-off: Rapidly expanding merchant base increases product selection but may introduce quality issues
- Balancing Strategy: Implement tiered merchant verification, use customer ratings to surface quality merchants, and develop clear quality standards with enforcement mechanisms
3. Checkout Simplicity vs. Purchase Protection
- Trade-off: Streamlining checkout increases conversion but may reduce fraud prevention capabilities
- Balancing Strategy: Use risk-based authentication that applies stronger verification only for suspicious transactions, and develop a robust but simple dispute resolution process
4. Creator Monetization vs. Authentic Content
- Trade-off: Higher creator commissions drive more shopping content but may reduce authenticity
- Balancing Strategy: Require disclosure of sponsored content, prioritize engagement metrics for creator shopping content, and reward creators whose shopping posts maintain high engagement
Step 7
Counter Metrics
1. Content Diversity Ratio
- Purpose: Ensures shopping content doesn't overwhelm users' feeds
- Avoiding Pitfalls: Prevents Instagram from becoming perceived as "just a shopping app"
- Action Trigger: If shopping posts exceed 30% of feed content for non-shopping-oriented users, adjust the algorithm to rebalance content mix
2. User Complaint Rate
- Purpose: Monitors negative shopping experiences
- Avoiding Pitfalls: Identifies problematic merchants or product categories early
- Action Trigger: If complaints exceed 2% of transactions, investigate merchant patterns and potentially remove problematic sellers
3. Time to Resolution for Shopping Issues
- Purpose: Ensures customer service quality for shopping-related problems
- Avoiding Pitfalls: Prevents erosion of trust in Instagram as a shopping platform
- Action Trigger: If average resolution time exceeds 48 hours, allocate additional support resources or improve self-service resolution tools
Strategic Initiatives
1. Creator-Driven Shopping Experience
- Rationale: Creators drive authentic product discovery and have established trust with followers
- Metric Impact: Would increase Shopping Engagement Rate and Conversion Rate
- Challenges: Maintaining content authenticity and developing fair compensation models
2. Personalized Shopping Tab
- Rationale: Customized shopping experiences based on user behavior increase relevance
- Metric Impact: Would improve Shopping Engagement Rate and potentially AOV
- Challenges: Balancing personalization with product discovery and managing data privacy concerns
3. Seamless Returns Process
- Rationale: Reducing purchase anxiety increases conversion rates
- Metric Impact: Would improve Conversion Rate and potentially reduce negative impact on Customer Satisfaction
- Challenges: Coordinating with diverse merchants and managing the operational complexity
Conclusion
Instagram Shopping metrics will need to evolve as the feature matures. As competition intensifies with TikTok Shop and others, we may need to focus more on retention metrics and repeat purchase behavior. Additionally, emerging technologies like AR try-on and live shopping will require new metrics to capture their unique value propositions.
The ultimate success of Instagram Shopping depends on balancing commerce with Instagram's core social value. Our metrics framework needs to reflect this balance, ensuring we drive commercial outcomes without compromising the user experience that made Instagram successful in the first place.
.png)