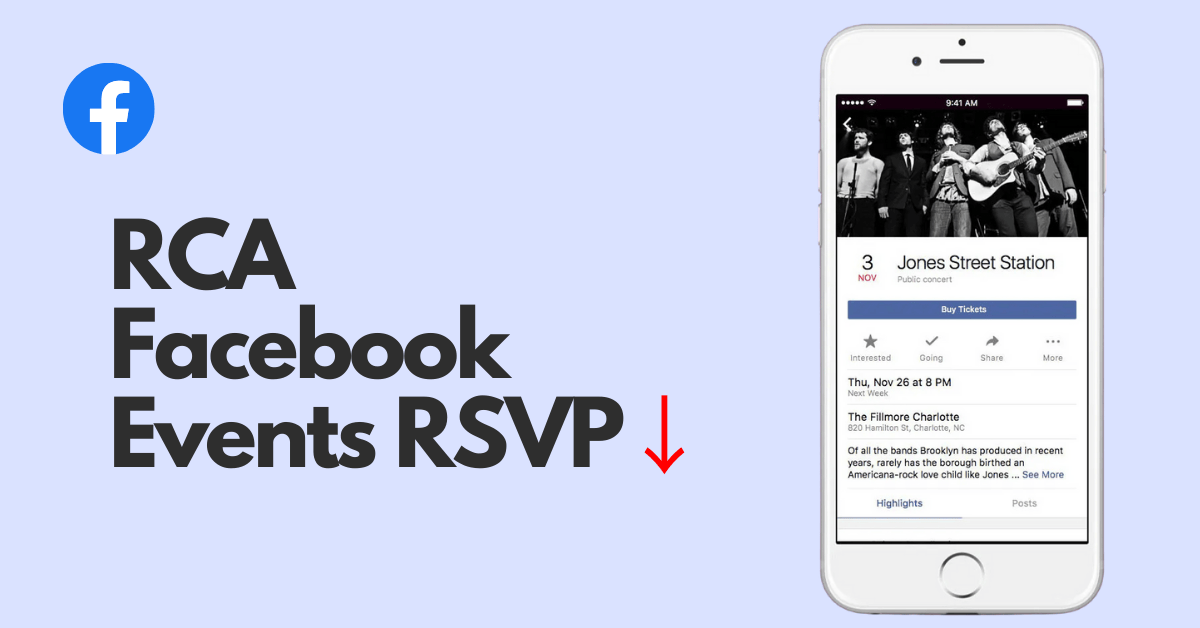
I'll follow a strucured framework to identify the underlying issues and develop effective solutions. A 45% drop represents a critical situation that demands immediate attention.
Step 1
Clarifying Questions (3 minutes)
- Why it matters: A sudden drop might indicate a technical issue or product change, while a gradual decline could suggest shifting user behavior.
- Expected answer: "It happened over the last 2 weeks."
- Impact on approach: A sudden drop would lead me to prioritize technical and recent product changes, while a gradual decline would focus more on user behavior trends.
- Why it matters: Identifying patterns in affected segments helps narrow down potential causes.
- Expected answer: "The decline is more pronounced in public events (60% drop) compared to private events (30% drop)."
- Impact on approach: This would direct my investigation toward public event features or potential trust/privacy concerns.
- Why it matters: Sometimes metric changes reflect measurement issues rather than actual user behavior changes.
- Expected answer: "No changes to our tracking or calculation methods."
- Impact on approach: If there were changes, I'd focus on data pipeline issues; if not, I'd prioritize product and user behavior hypotheses.
- Why it matters: Product changes often directly impact user behavior metrics.
- Expected answer: "We rolled out a new Events UI two weeks ago and adjusted the notification algorithm."
- Impact on approach: This would make me prioritize investigating these specific changes as potential causes.
- Why it matters: Helps distinguish between Events-specific issues and platform-wide trends.
- Expected answer: "Other engagement metrics are stable; this appears isolated to Events."
- Impact on approach: If isolated, I'd focus on Events-specific factors; if widespread, I'd consider broader platform or external issues.
Step 2
Rule Out Basic External Factors (3 minutes)
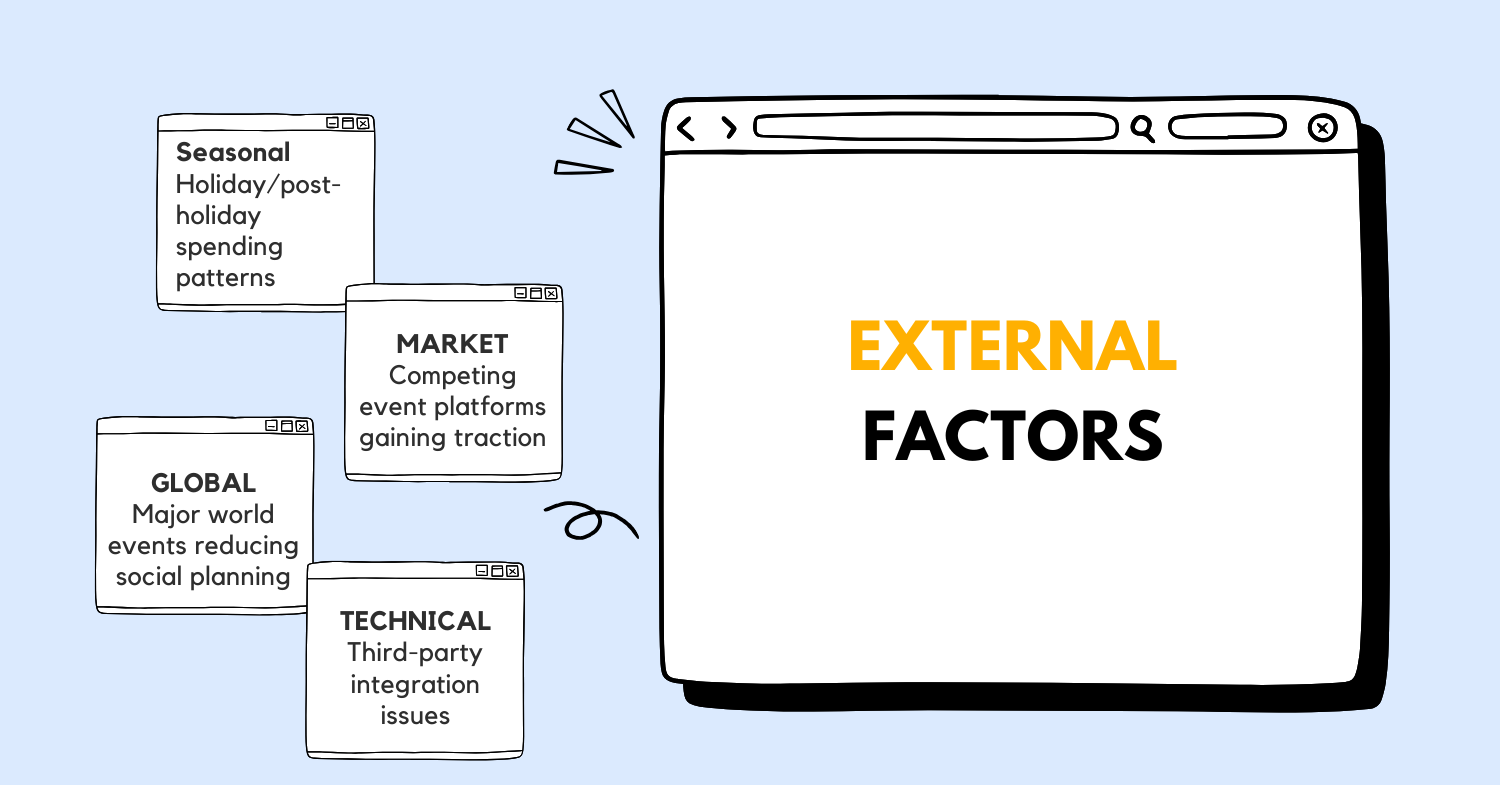 Before diving deep into internal factors, let's quickly assess potential external causes:
| Category | Factors | Impact Assessment | Status |
|---|---|---|---|
| Natural | Seasonal trends (summer vacation period) | Medium - could explain partial decline | Consider |
| Market | Competing event platforms gaining traction | Low - unlikely to cause sudden 45% drop | Rule out |
| Global | Major world events reducing social planning | Low - would affect all social features | Rule out |
| Technical | Third-party integration issues | Medium - could affect event creation/discovery | Consider |
The 45% drop is too significant and sudden to be explained solely by seasonal trends or gradual competitive shifts. While seasonal factors might contribute partially, they wouldn't account for such a dramatic decline. Similarly, if global factors were at play, we'd expect to see impacts across multiple Facebook features, not just Events.
Step 3
Product Understanding and User Journey (3 minutes)
Facebook Events is a core social coordination feature that allows users to create, discover, and respond to events. Its value proposition centers on simplifying social planning and increasing real-world connections among users.
A typical user journey for RSVPing to an event involves:
- Discovery - User sees event in News Feed, Events tab, or via direct invitation
- Consideration - Reviews event details, host, attendees, location, and timing
- Decision - Evaluates personal interest and availability
- Action - Clicks "Going," "Interested," or "Not Going" (our RSVP metric tracks "Going" and "Interested" responses)
- Follow-up - Receives notifications about event updates, reminders, and post-event content
Edge cases include users who view events but delay responding, those who respond but later change their RSVP status, and passive browsers who regularly view events without responding.
The RSVP rate is critical because it:
- Drives event creator satisfaction and retention
- Increases platform engagement through pre/post-event interactions
- Provides valuable social signal data for the recommendation algorithm
- Creates meaningful user connections that strengthen the Facebook ecosystem
Step 4
Metric Breakdown (3 minutes)
The RSVP rate for Facebook Events is defined as: (Number of "Going" + "Interested" responses) / (Number of event impressions) × 100%
Breaking down this metric helps identify where in the funnel the issue might be occurring:
This breakdown reveals several potential failure points:
- Impression issues - Events might be getting fewer impressions overall
- Discovery problems - Events could be less discoverable in News Feed or Events tab
- Notification failures - Event invitations might not be reaching users
- Response friction - The RSVP action itself might have become more difficult
- Content quality - The events being created might be less appealing to users
Step 5
Data Gathering and Prioritization (3 minutes)
To investigate this issue effectively, I would request the following data:
| Data Type | Purpose | Priority | Source |
|---|---|---|---|
| RSVP funnel metrics | Track where users are dropping off | High | Analytics Dashboard |
| Event impressions by surface | Identify if visibility has changed | High | Impression Logs |
| UI interaction heatmaps | Detect changes in user interaction patterns | Medium | UX Research Tools |
| A/B test results from recent changes | Identify impact of recent product updates | High | Experimentation Platform |
| Notification delivery & open rates | Check if notifications are reaching users | Medium | Notification System |
| User feedback & support tickets | Identify reported issues | Medium | Support Dashboard |
| Server error logs | Detect technical issues | High | Error Tracking System |
| Event creation metrics | Check if there's an issue with event supply | Medium | Creator Analytics |
I'm prioritizing funnel metrics, impression data, and recent A/B test results because they'll quickly help us determine whether this is a visibility issue, an interaction problem, or potentially related to recent product changes.
Step 6
Hypothesis Formation (6 minutes)
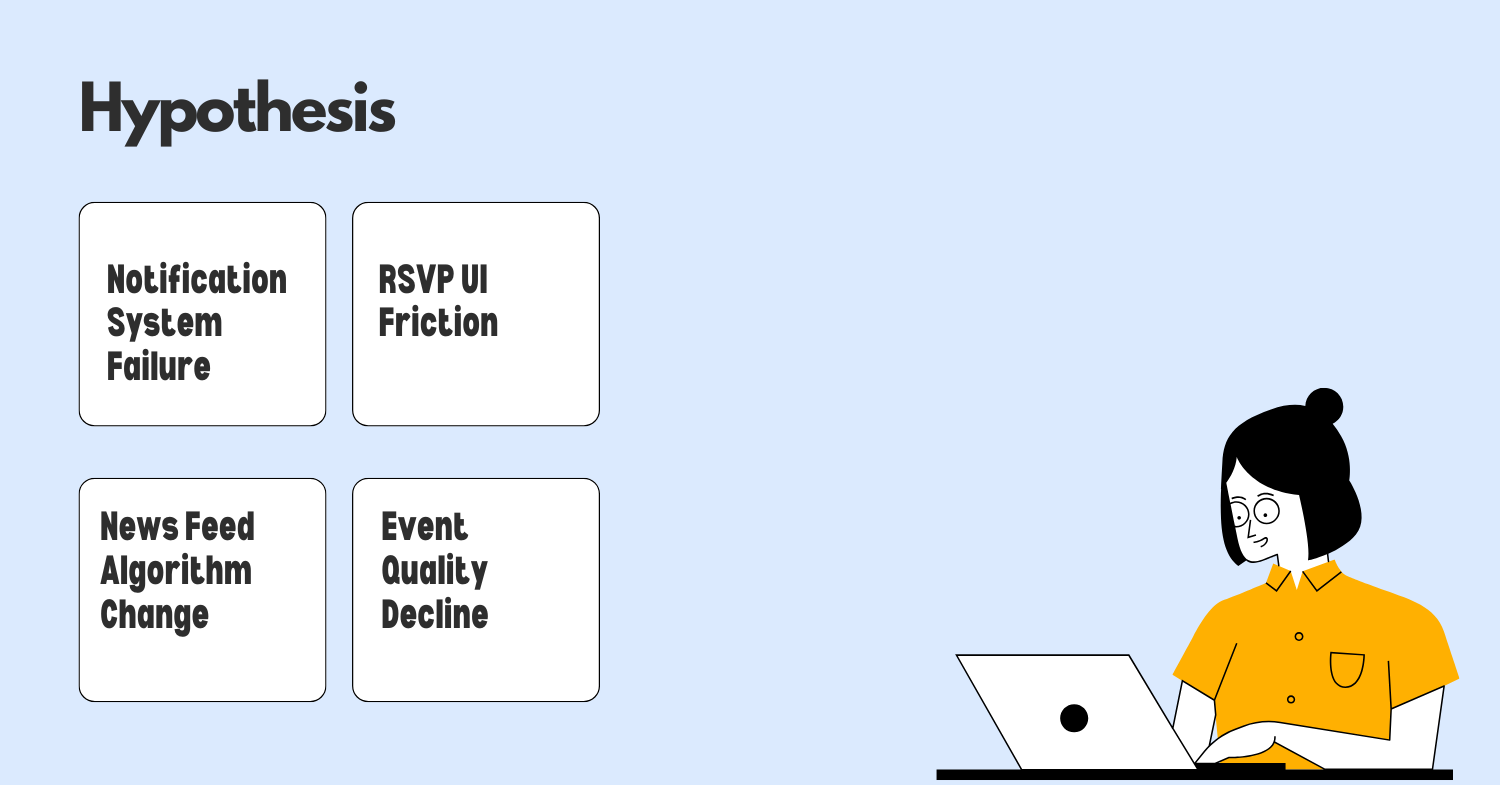 Based on the information gathered, I've developed four primary hypotheses:
-
Technical Hypothesis: Notification System Failure
- Evidence: If notification delivery or open rates have declined significantly
- Impact: Users aren't receiving or seeing event invitations
- Validation approach: Compare notification delivery metrics before and after the decline began
-
User Behavior Hypothesis: RSVP UI Friction
- Evidence: If the new Events UI changed the RSVP button placement or interaction model
- Impact: Users find it more difficult or confusing to RSVP
- Validation approach: Analyze UI interaction heatmaps and session recordings
-
Product Change Hypothesis: News Feed Algorithm Change
- Evidence: If event impressions in News Feed have declined while Events tab impressions remain stable
- Impact: Events are getting less visibility in the primary discovery surface
- Validation approach: Compare impression sources before and after the decline
-
External Factor Hypothesis: Event Quality Decline
- Evidence: If event creation patterns have changed or user-reported quality has decreased
- Impact: Users see events but don't find them compelling enough to respond
- Validation approach: Analyze event content metrics and user feedback
Step 7
Root Cause Analysis (5 minutes)
Applying the "5 Whys" technique to each hypothesis:
Hypothesis 1: Notification System Failure
- Why did the RSVP rate drop? Because users aren't responding to events.
- Why aren't users responding? Because they're not seeing event invitations.
- Why aren't they seeing invitations? Because notifications aren't being delivered or opened.
- Why aren't notifications being delivered/opened? Because of a potential technical issue in the notification system.
- Why is there a technical issue? Possibly due to a recent deployment that affected notification delivery or prioritization.
Hypothesis 2: RSVP UI Friction
- Why did the RSVP rate drop? Because users aren't completing the RSVP action.
- Why aren't they completing it? Because the interaction has become more difficult.
- Why is it more difficult? Because the new UI changed how users interact with events.
- Why did the UI change create problems? Because it may have violated user expectations or added steps.
- Why did we implement a problematic UI? Possibly because we optimized for visual design over usability or didn't test with enough user segments.
Hypothesis 3: News Feed Algorithm Change
- Why did the RSVP rate drop? Because fewer users are seeing events.
- Why are fewer users seeing events? Because events have reduced visibility in News Feed.
- Why is there reduced visibility? Because the algorithm was updated to prioritize other content.
- Why was the algorithm updated? To optimize for different engagement metrics.
- Why did this optimization hurt Events? Because the algorithm changes didn't account for the impact on Events as a use case.
Hypothesis 4: Event Quality Decline
- Why did the RSVP rate drop? Because users are less interested in the events they see.
- Why are they less interested? Because the events are less relevant or compelling.
- Why are events less relevant? Because event recommendations or creation patterns have changed.
- Why have patterns changed? Because of creator behavior shifts or recommendation algorithm changes.
- Why did these changes occur? Possibly due to seasonal factors or unintended consequences of platform changes.
Based on the timing coinciding with a UI update and the differential impact on public vs. private events, I believe Hypothesis 2 (RSVP UI Friction) is most likely, potentially combined with Hypothesis 3 (News Feed Algorithm Change).
Step 8
Validation and Next Steps (5 minutes)
To validate these hypotheses and address the issue:
| Hypothesis | Validation Method | Success Criteria | Timeline |
|---|---|---|---|
| UI Friction | A/B test reverting to old UI for sample users | RSVP rate returns to previous levels | 3-5 days |
| News Feed Algorithm | Analyze event impression data by surface | Identify if Feed impressions dropped while other surfaces remained stable | 1-2 days |
| Notification System | Audit notification delivery funnel | Identify any drops in delivery or open rates | 1-2 days |
| Event Quality | Analyze event content metrics and user feedback | Identify changes in event characteristics or sentiment | 3-5 days |
For our most likely hypothesis (UI Friction), I would:
- Immediately conduct usability testing with 5-10 users to observe interaction with the new UI
- Analyze heatmaps and session recordings focusing on RSVP button interactions
- Launch an A/B test reverting to the old UI for a sample of users
- Survey users who have seen events but not responded since the change
For the News Feed Algorithm hypothesis:
- Work with the Feed team to analyze recent algorithm changes
- Compare event impression sources before and after the decline
- Run a temporary experiment boosting event visibility for a sample of users
Step 9
Decision Framework (3 minutes)
Based on our validation results, here's how we'll proceed:
| Condition | Action 1 | Action 2 |
|---|---|---|
| UI friction confirmed as primary cause | Immediately revert to previous UI | Redesign new UI with extensive usability testing |
| News Feed visibility confirmed as primary cause | Adjust algorithm parameters for events | Create dedicated Events promotion strategy |
| Notification issues confirmed | Fix technical bugs in notification system | Review and optimize notification strategy |
| Multiple factors confirmed | Address highest impact factor first | Develop comprehensive plan for secondary factors |
| No clear single cause identified | Implement multivariate testing | Conduct deeper user research on RSVP behavior |
If we confirm UI friction is the issue, we should also:
- Document the specific UI elements causing confusion
- Establish stronger usability testing protocols for future changes
- Review our metrics to ensure we're tracking the right signals during UI changes
Step 10
Resolution Plan (2 minutes)
-
Immediate Actions (24-48 hours)
- Launch A/B test reverting to previous UI for 10% of users
- Implement enhanced monitoring of RSVP funnel metrics
- Add prominent feedback mechanism for users experiencing difficulties
- Brief support team on potential issues and workarounds
-
Short-term Solutions (1-2 weeks)
- Implement UI fixes based on initial findings
- Adjust News Feed algorithm parameters if visibility is contributing
- Optimize notification delivery and content if relevant
- Communicate transparently with event creators about the issue and resolution
-
Long-term Prevention (1-3 months)
- Establish stricter UI change protocols with required usability testing
- Develop early warning system for critical engagement metrics
- Create cross-functional review process for changes affecting core features
- Build more robust A/B testing framework for gradual rollouts of major changes
This approach addresses the immediate RSVP rate issue while also strengthening our processes to prevent similar problems in the future.
.png)