
In analyzing this 5% drop in Instagram ad revenue, I'll follow a systematic framework to identify, validate, and address the root cause while considering both immediate and long-term implications. I'll approach this by first clarifying the context, breaking down the revenue components, generating hypotheses, and then developing a structured plan to address the issue.
Does this sound alright?
Step 1
Clarifying Questions (3 minutes)
- Why it matters: Different timeframes suggest different potential causes - seasonal patterns versus sudden technical issues.
- Expected answer: Month-over-month decline
- Impact on approach: A sudden monthly drop would focus my investigation on recent changes rather than long-term trends.
- Why it matters: Isolating whether this is a platform-wide issue or specific to certain ad formats dramatically narrows our investigation.
- Expected answer: Primarily affecting Feed ads, with Stories and Reels stable
- Impact on approach: Would direct our focus to Feed-specific technical or user engagement issues.
- Why it matters: Helps determine if this is a broad platform issue or related to specific advertiser segments.
- Expected answer: Particularly affecting mid-market retail advertisers
- Impact on approach: Would shift focus to either industry-specific external factors or targeting capabilities for those segments.
- Why it matters: Often revenue fluctuations follow product or policy changes that affect ad delivery or effectiveness.
- Expected answer: Recent feed algorithm update to prioritize certain content types
- Impact on approach: Would focus investigation on how algorithm changes might have affected ad visibility and performance.
- Why it matters: Sometimes "performance changes" are actually measurement artifacts rather than true business changes.
- Expected answer: No changes to measurement systems
- Impact on approach: Would rule out measurement issues and focus on actual performance factors.
Step 2
Rule Out Basic External Factors (3 minutes)
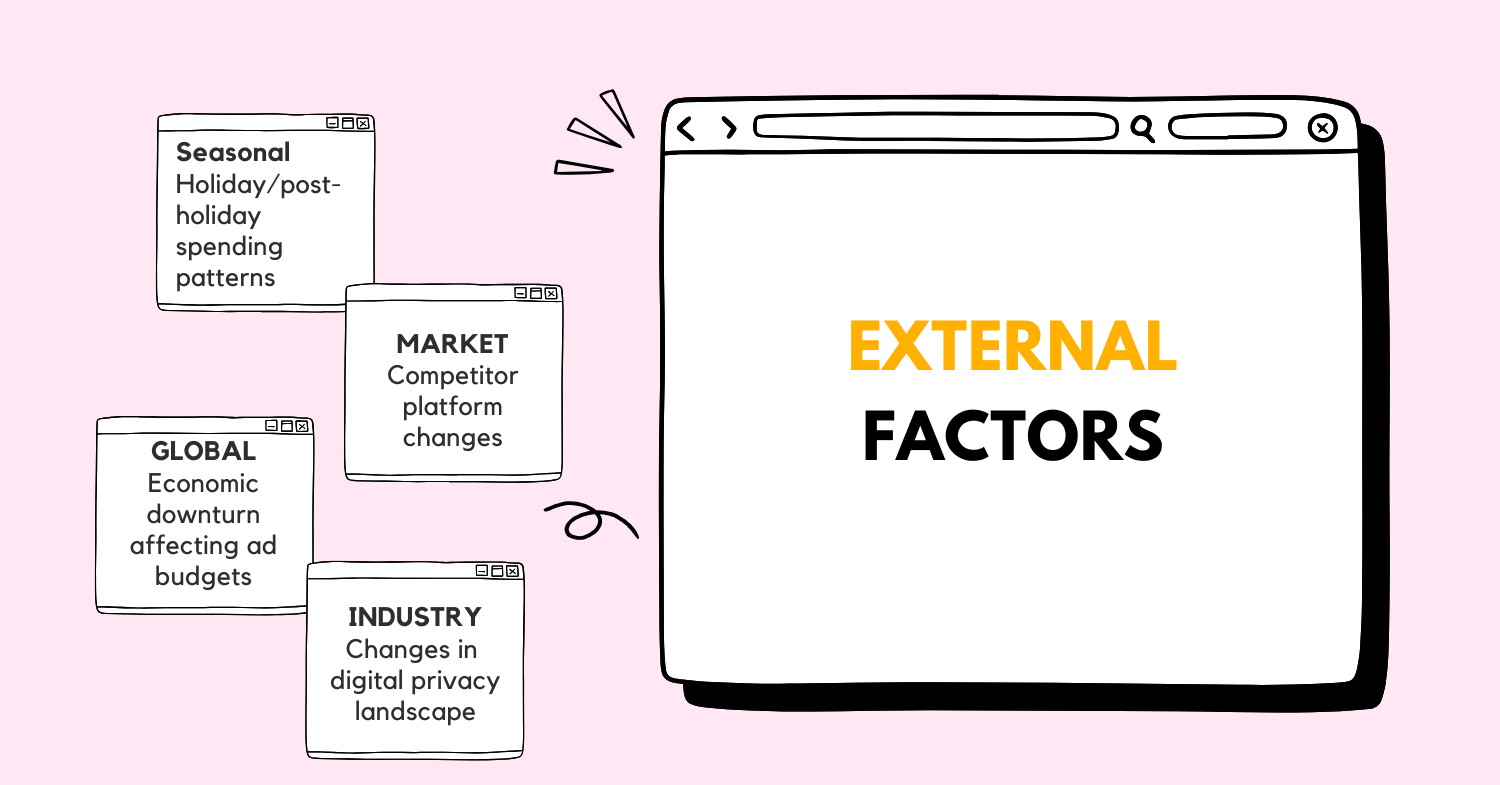 Before diving deeper, I want to quickly assess potential external factors that might explain the revenue drop:
| Category | Factors | Impact Assessment | Status |
|---|---|---|---|
| Seasonal | Holiday/post-holiday spending patterns | Medium - advertisers often reduce budgets after peak seasons | Consider - check if aligned with expected seasonal patterns |
| Market | Competitor platform changes (TikTok, YouTube) | High - could be drawing ad spend away | Consider - analyze cross-platform spending trends |
| Global | Economic downturn affecting ad budgets | High - would affect multiple platforms | Rule out if Instagram-specific |
| Industry | Changes in digital privacy landscape | Medium - could affect targeting effectiveness | Consider - check if coincides with iOS/browser updates |
| Technical | Tracking/attribution changes | High - could affect reported performance | Rule out if measurement systems unchanged |
The 5% drop seems significant enough that it's unlikely to be purely seasonal, especially if it's isolated to Instagram rather than affecting all Meta properties. If competitors aren't seeing similar drops, we should focus on Instagram-specific factors. Economic factors would typically affect multiple platforms simultaneously, so if this is Instagram-specific, we can likely rule that out.
I'd want to confirm if any major privacy changes (like iOS updates) coincided with our revenue decline, as these have historically impacted social media ad performance.
Step 3
Product Understanding and User Journey (3 minutes)
Instagram's core value proposition centers on visual discovery and connection through photos, videos, and Stories. The advertising model is integrated into this experience, with ads appearing in users' feeds, Stories, and Reels in a format similar to organic content.
A typical user journey for Instagram ad exposure:
- User opens Instagram app
- Scrolls through Feed, views Stories, or explores Reels
- Encounters ads interspersed with organic content
- Either engages with ad (click, save, share) or continues scrolling
- Potential conversion on advertiser's site/app after clicking
For advertisers, the journey involves:
- Creating campaigns in Ads Manager
- Selecting targeting parameters and placements
- Setting budgets and bidding strategies
- Uploading creative assets
- Monitoring performance metrics
- Optimizing based on results
Ad revenue is directly tied to:
- Number of ads served (inventory)
- Cost per impression (CPM)
- Click-through rates (engagement)
- Conversion rates (effectiveness)
A 5% drop in revenue could stem from changes in any of these factors. If users are spending less time on the platform, we'd see fewer ads served. If ad quality or targeting has declined, we might see lower CPMs or engagement rates. If recent product changes have altered the user experience, this could affect how users interact with ads.
Step 4
Metric Breakdown (3 minutes)
Instagram ad revenue can be broken down into its constituent components to better understand where the 5% drop might be occurring:
This breakdown helps us understand that ad revenue is fundamentally: Revenue = Ad Impressions × Average CPM
Where:
- Ad Impressions = DAUs × Time Spent × Ad Load
- Average CPM is influenced by advertiser demand, ad quality, and performance metrics
By segmenting this data across dimensions like:
- Geographic regions
- Ad formats (Feed, Stories, Reels)
- Advertiser verticals
- User demographics
- Device types
We can pinpoint where exactly the revenue drop is occurring. For instance, if impressions are stable but CPMs are dropping, we'd focus on advertiser demand or ad performance issues. Conversely, if impressions are dropping while CPMs remain stable, we'd investigate user engagement or ad load changes.
Step 5
Data Gathering and Prioritization (3 minutes)
To diagnose the 5% ad revenue drop, I would request the following data:
| Data Type | Purpose | Priority | Source |
|---|---|---|---|
| Revenue breakdown by ad placement | Identify if drop is specific to certain placements | High | Ad Revenue Dashboard |
| DAU and time spent metrics | Determine if user engagement has changed | High | User Analytics Platform |
| Ad impression volume trends | Check if we're serving fewer ads | High | Ad Serving System |
| CPM trends by advertiser segment | Identify if certain advertisers are paying less | High | Pricing Analytics |
| Click-through and conversion rates | Assess if ad performance has declined | Medium | Performance Dashboard |
| Recent product changes log | Correlate revenue drop with product updates | High | Release Management System |
| Advertiser spend patterns | Check if advertisers are reducing budgets | Medium | Advertiser Analytics |
| Competitor ad performance | Benchmark against industry trends | Medium | Market Research Data |
| User feedback on ads | Identify potential quality issues | Low | User Research/Surveys |
| Technical error logs | Check for ad serving issues | Medium | Error Monitoring System |
I'd prioritize data that helps us quickly determine whether the issue is with:
- Supply-side factors (user engagement, ad load)
- Demand-side factors (advertiser spending, bidding)
- Performance factors (ad quality, targeting effectiveness)
- Technical factors (delivery issues, bugs)
Cross-functional collaboration with engineering, data science, and sales teams would be essential to ensure we're interpreting the data correctly and considering all potential factors.
Step 6
Hypothesis Formation (6 minutes)
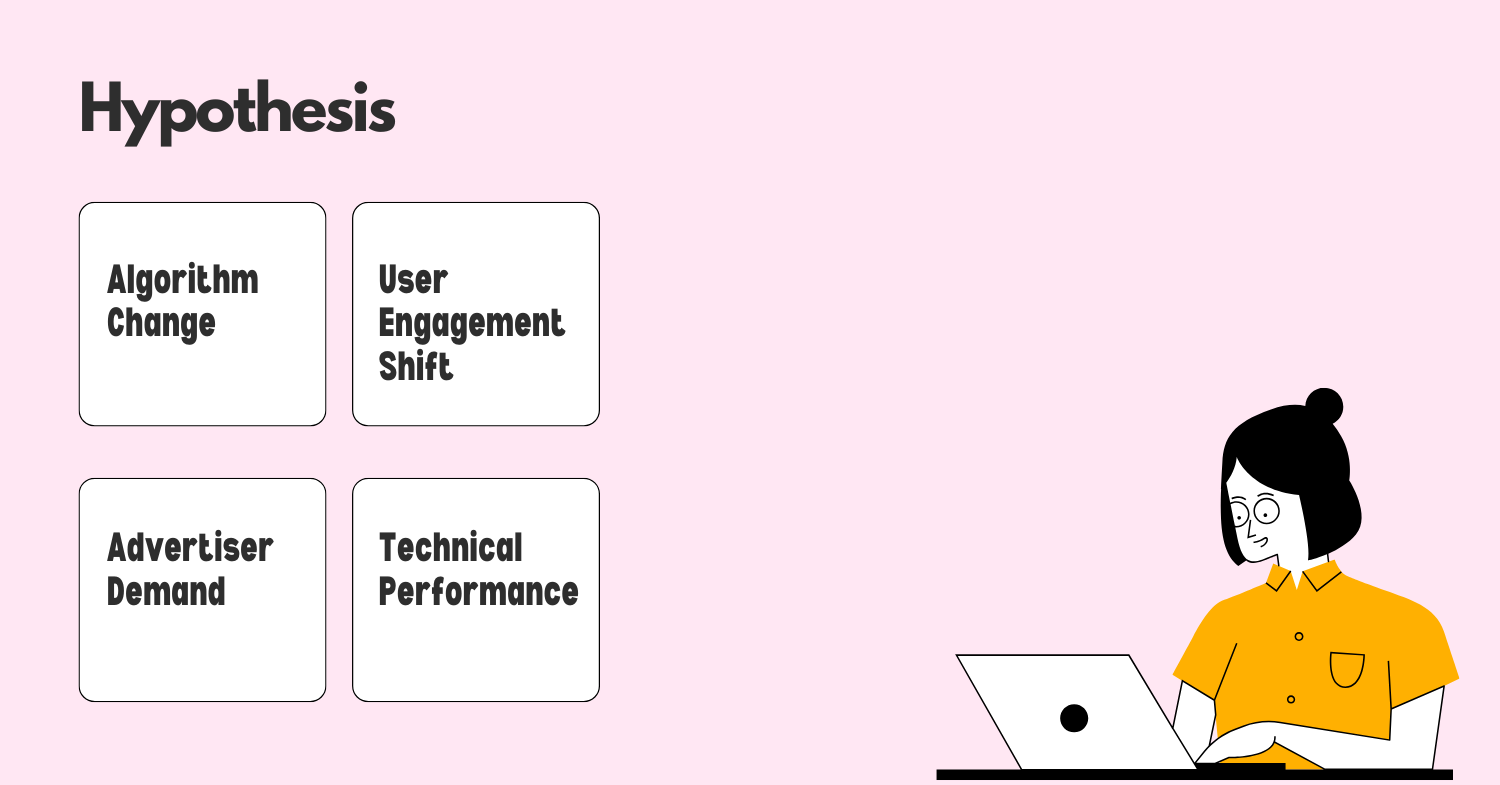 Based on the potential factors affecting Instagram ad revenue, I've developed four primary hypotheses:
1. Algorithm Change Hypothesis
Recent feed algorithm updates may have inadvertently reduced ad visibility or effectiveness.
Evidence points:
- Timing coincides with known algorithm update
- Feed ads specifically affected while Stories/Reels ads remain stable
- Similar patterns observed in previous algorithm changes
Impact assessment: If confirmed, this would require algorithm fine-tuning to restore ad visibility while maintaining user experience quality.
Validation approach:
- Compare ad position in feed pre/post algorithm change
- Analyze viewability metrics and scroll-through rates
- A/B test algorithm variants to measure revenue impact
2. User Engagement Shift Hypothesis
Users may be spending less time in feed and more time in other areas of the app where ad load or effectiveness is lower.
Evidence points:
- Overall DAU remains stable but feed engagement metrics show decline
- Increased usage of Reels or other features with different monetization rates
- Seasonal patterns in content consumption
Impact assessment: If confirmed, we need to either improve feed engagement or accelerate monetization in growing surfaces.
Validation approach:
- Analyze time spent by surface area (Feed vs. Stories vs. Reels)
- Review scroll depth and session length metrics
- Segment by user cohorts to identify if specific groups are changing behavior
3. Advertiser Demand Hypothesis
Advertisers may be reducing spend or reallocating budgets to other platforms.
Evidence points:
- Decreased auction competition leading to lower CPMs
- Certain advertiser segments showing larger spending declines
- Changes in campaign objectives or bidding strategies
Impact assessment: If confirmed, we need to address advertiser concerns about performance or explore new value propositions.
Validation approach:
- Analyze advertiser retention and spending patterns
- Review competitive intelligence on cross-platform spending
- Conduct advertiser interviews to understand decision factors
4. Technical Performance Hypothesis
Ad delivery or measurement systems may be experiencing issues affecting either actual or reported revenue.
Evidence points:
- Discrepancies between served impressions and billable impressions
- Increased error rates in ad delivery systems
- Changes in attribution windows or measurement methodology
Impact assessment: If confirmed, requires immediate technical fixes and potential revenue reconciliation.
Validation approach:
- Audit ad serving logs for delivery failures
- Compare client-side vs. server-side impression counts
- Review recent code deployments affecting ad systems
Step 7
Root Cause Analysis (5 minutes)
Applying the "5 Whys" technique to each hypothesis:
Algorithm Change Hypothesis
- Why did ad revenue drop? Because ads are generating fewer clicks and conversions.
- Why are ads generating fewer clicks? Because they're receiving less user attention.
- Why are they receiving less attention? Because they're appearing in less prominent positions in the feed.
- Why are they in less prominent positions? Because the new algorithm prioritizes certain content types over others.
- Why does the algorithm prioritize this way? Because it was optimized for user engagement metrics without fully accounting for ad performance impact.
This suggests the root cause could be an algorithm change that inadvertently deprioritized ad content, creating a trade-off between user engagement and monetization that wasn't fully anticipated.
User Engagement Shift Hypothesis
- Why did ad revenue drop? Because fewer ad impressions are being served.
- Why are fewer impressions served? Because users are spending less time where ads are shown.
- Why are users spending less time there? Because they're shifting attention to newer features.
- Why are they shifting to newer features? Because these features offer more engaging content.
- Why isn't ad revenue following this shift? Because monetization in these new surfaces isn't yet at parity with feed ads.
This suggests the root cause could be a natural evolution in user behavior that our monetization strategy hasn't fully adapted to yet.
Advertiser Demand Hypothesis
- Why did ad revenue drop? Because advertisers are spending less.
- Why are advertisers spending less? Because they're seeing lower return on ad spend (ROAS).
- Why is ROAS lower? Because conversion rates have declined.
- Why have conversion rates declined? Because targeting effectiveness has decreased.
- Why has targeting effectiveness decreased? Because recent privacy changes have limited data availability.
This suggests the root cause could be external privacy changes affecting our targeting capabilities, which advertisers are responding to by reducing spend or reallocating to channels with better performance.
Technical Performance Hypothesis
- Why did ad revenue drop? Because fewer ads are being successfully delivered.
- Why are fewer ads delivered? Because the ad serving system is rejecting more ad requests.
- Why is it rejecting requests? Because of increased latency in the targeting system.
- Why is there increased latency? Because recent code changes added processing overhead.
- Why did code changes increase overhead? Because optimization for one metric inadvertently affected another.
This suggests the root cause could be technical debt or unintended consequences from recent engineering changes.
Based on the evidence mentioned earlier (particularly that Feed ads are specifically affected while Stories/Reels remain stable), the Algorithm Change Hypothesis seems most plausible. The timing correlation with a known algorithm update strongly suggests this is the primary factor, though it could be compounded by shifts in user behavior.
Step 8
Validation and Next Steps (5 minutes)
To validate our hypotheses and address the revenue drop, I propose the following approach:
| Hypothesis | Validation Method | Success Criteria | Timeline |
|---|---|---|---|
| Algorithm Change | A/B test reverting specific algorithm components | Revenue recovery without user engagement drop | 1 week |
| User Engagement Shift | Cohort analysis of user behavior changes | Clear correlation between engagement shifts and revenue | 3-5 days |
| Advertiser Demand | Advertiser surveys and spend pattern analysis | Identification of specific advertiser concerns | 1 week |
| Technical Performance | System audit and performance testing | Identification of specific technical bottlenecks | 2-3 days |
For our most likely hypothesis (Algorithm Change):
-
Immediate validation:
- Analyze pre/post algorithm change data on ad positions in feed
- Compare viewability and engagement metrics before and after
- Review any A/B tests that preceded the full rollout
-
Short-term solution:
- Implement quick algorithm adjustments to restore ad visibility
- Consider temporary CPM floor adjustments to stabilize revenue
- Communicate transparently with key advertisers about the situation
-
Long-term approach:
- Redesign algorithm testing process to include revenue impact assessment
- Develop more sophisticated balancing mechanisms between user experience and monetization
- Create early warning systems for detecting monetization impacts from product changes
For measuring success, I would track:
- Daily revenue trends compared to pre-drop baseline
- Ad position and viewability metrics
- User engagement metrics to ensure we're not sacrificing experience for revenue
- Advertiser satisfaction and retention metrics
The key risk with algorithm adjustments is potentially harming user experience to restore revenue. We'll need to find the right balance rather than simply reverting changes, as the original update likely had valid user experience benefits.
Step 9
Decision Framework (3 minutes)
Based on our validation results, here's a decision framework for addressing the root cause:
| Validation Outcome | Primary Action | Secondary Action |
|---|---|---|
| Algorithm change confirmed as primary cause | Implement targeted algorithm adjustments to restore ad visibility while preserving engagement benefits | Review algorithm change approval process to include revenue impact assessment |
| User behavior shift confirmed | Accelerate monetization improvements in growing surfaces (Reels, Stories) | Develop content strategy to re-engage users with feed content |
| Advertiser demand issues confirmed | Launch performance improvement initiatives for affected advertiser segments | Develop new ad products to address changing advertiser needs |
| Technical issues confirmed | Deploy immediate fixes to ad serving systems | Implement improved monitoring and testing protocols |
| Multiple factors confirmed | Prioritize fixes based on revenue impact and implementation speed | Form cross-functional task force to address systemic issues |
If we confirm the algorithm change hypothesis:
- For severe impact (>10% revenue drop): Consider partial rollback while developing optimized solution
- For moderate impact (5-10%): Implement targeted adjustments without full rollback
- For mild impact (<5%): Make gradual optimizations while monitoring both revenue and engagement
This framework ensures we're making decisions based on data rather than assumptions, and that we're considering both short-term revenue recovery and long-term product health.
Step 10
Resolution Plan (2 minutes)
Immediate Actions (24-48 hours)
- Form a cross-functional "tiger team" with representatives from product, engineering, data science, and sales
- Implement monitoring dashboards to track revenue recovery in real-time
- If algorithm change is confirmed as the cause, deploy quick adjustments to most affected areas
- Communicate transparently with internal stakeholders about the issue and resolution timeline
- Prepare talking points for advertiser-facing teams to maintain confidence
Short-term Solutions (1-2 weeks)
- Refine algorithm parameters based on A/B test results
- Develop and implement improved testing protocols for future algorithm changes
- Analyze user segments most affected by the change and develop targeted engagement strategies
- Review ad load and placement strategies across all surfaces
- Conduct advertiser feedback sessions to identify other improvement opportunities
Long-term Prevention (1-3 months)
- Redesign the product change review process to include revenue impact assessments
- Develop more sophisticated balancing mechanisms between user experience and monetization goals
- Create an early warning system that can detect potential revenue impacts before they become significant
- Invest in diversifying revenue streams across different Instagram surfaces
- Build more resilient ad systems that can adapt to changing user behaviors
This approach addresses not just the immediate revenue drop but also strengthens our systems to prevent similar issues in the future. It balances the need for quick recovery with sustainable long-term solutions.
.png)