
In analyzing this peer-to-peer money transfer product issue, I'll follow a systematic framework to identify, validate, and address the root cause while considering both immediate and long-term implications.
The core problem we're facing is that the average amount per transfer has decreased while the total processed amount has remained constant over the last three months. This suggests a fundamental shift in user behavior or product usage patterns that requires thorough investigation.
This analysis follows a structured approach covering issue identification, hypothesis generation, validation, and solution development to understand why our average transfer amount is decreasing while total volume remains stable.
Step 1
Clarifying Questions
- Why it matters: Changes in measurement methodology could create false signals about user behavior.
- Expected answer: No changes in measurement methodology.
- Impact on approach: If yes, we'd need to normalize the data before analysis; if no, we can focus on actual behavior changes.
- Why it matters: This would confirm if users are simply breaking larger transfers into smaller ones or if there's a new segment of users making smaller transfers.
- Expected answer: Yes, there's been an increase in transfer frequency.
- Impact on approach: This would direct our investigation toward understanding why users are making more frequent, smaller transfers.
- Why it matters: New user segments often exhibit different behavior patterns than established users.
- Expected answer: Some shift in user demographics or a new cohort of users.
- Impact on approach: If yes, we'd segment our analysis to understand these new users' behaviors; if no, we'd focus on changes in existing users' behavior.
- Why it matters: Product changes often drive behavior changes, sometimes in unexpected ways.
- Expected answer: Details about recent product updates or campaigns.
- Impact on approach: This would help us correlate specific changes with the observed metric shift.
- Why it matters: External factors often drive behavioral changes across the entire market.
- Expected answer: Information about competitive landscape changes.
- Impact on approach: This would help determine if this is an industry-wide trend or specific to our product.
Step 2
Rule Out Basic External Factors
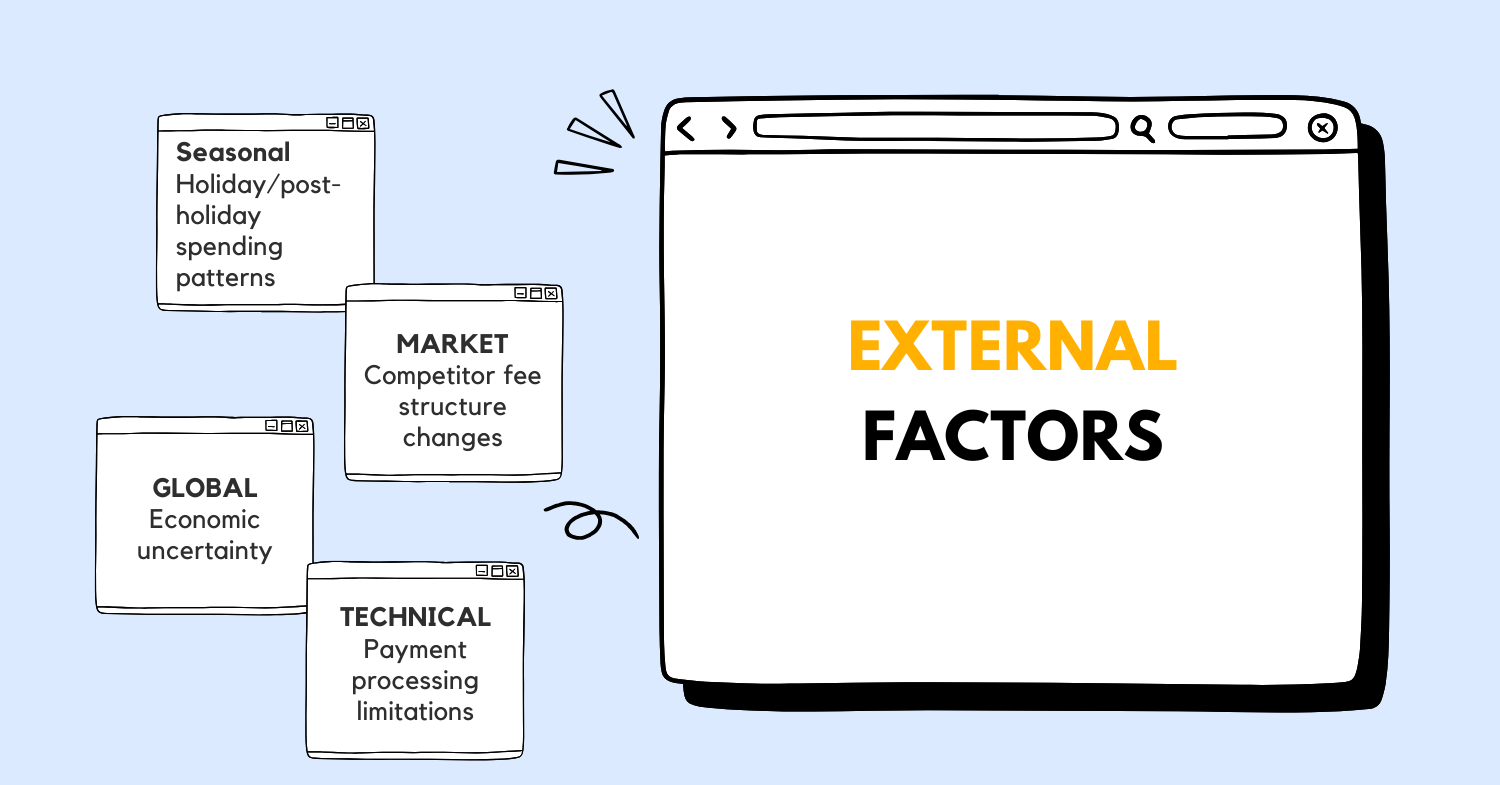 Before diving deeper, let's quickly assess potential external factors that might explain this pattern:
| Category | Factors | Impact Assessment | Status |
|---|---|---|---|
| Natural | Seasonal spending patterns | Medium - could affect transfer amounts | Consider - but would likely affect total volume too |
| Market | Competitor fee structure changes | High - could drive smaller transfers | Consider - competitors may have introduced free small transfers |
| Global | Economic uncertainty | Medium - might cause more cautious spending | Consider - could lead to smaller, more frequent transfers |
| Technical | Payment processing limitations | Low - unlikely to change user behavior | Rule out - no known technical constraints introduced |
The stable total volume suggests that while external factors may influence behavior, they're not causing users to transfer less money overall. This points us toward changes in how users are interacting with our product rather than external constraints limiting usage.
It's tempting to immediately blame external factors like economic conditions, but the stable total volume suggests we should focus on user behavior patterns and potential product-driven changes first.
Step 3
Product Understanding and User Journey
Our peer-to-peer money transfer product allows users to send money directly to others quickly and securely. The core value proposition centers on convenience, speed, and reliability for everyday financial transactions between individuals.
A typical user journey includes:
- User logs into the app/website
- Selects a recipient (existing or new)
- Enters transfer amount
- Selects funding source (bank account, card, balance)
- Reviews fees and exchange rates (if applicable)
- Confirms and completes transfer
- Receives confirmation
- Recipient gets notified and accesses funds
The average transfer amount is a critical metric as it affects our revenue (especially if we charge percentage-based fees), influences our risk models, and impacts our processing costs. The total volume processed indicates overall product health and market penetration.
Some edge cases to consider include:
- Business users making large, infrequent transfers
- Regular recurring transfers (e.g., rent payments)
- Group collections (e.g., splitting bills)
- Cross-border transfers with currency conversion
- Emergency one-time transfers
The decrease in average amount with stable total volume suggests a fundamental shift in how users are leveraging our platform, potentially moving from fewer large transfers to more frequent smaller ones.
Step 4
Metric Breakdown
Let's break down the key metrics to understand their relationship:
- Total Volume Processed = Number of Transfers × Average Transfer Amount
- If Total Volume is constant while Average Transfer Amount decreases, then Number of Transfers must be increasing proportionally
This relationship suggests several potential factors:
- User behavior change - existing users making more frequent, smaller transfers
- User mix change - influx of new users with different transfer patterns
- Feature adoption - users leveraging new capabilities that encourage smaller transfers
- Use case evolution - shift in how people are using the product
To properly analyze this, we need to segment the data by:
- User tenure (new vs. existing)
- User demographics (age, location, income level)
- Transfer purpose (if captured)
- Transfer frequency per user
- Transfer size distribution
Step 5
Data Gathering and Prioritization
To investigate this issue thoroughly, I would request the following data:
| Data Type | Purpose | Priority | Source |
|---|---|---|---|
| Transfer size distribution over time | Identify shifts in transfer patterns | High | Transaction Database |
| Transfer frequency per user | Determine if users are making more transfers | High | User Analytics |
| New user acquisition rate | Check if user mix is changing | High | User Database |
| Feature usage metrics | Identify adoption of features that might influence behavior | Medium | Product Analytics |
| User segment analysis | Understand behavior differences across segments | Medium | CRM System |
| Competitive analysis | Identify market trends or competitive responses | Medium | Market Research |
| User feedback/support tickets | Capture qualitative insights about changing behavior | Medium | Support System |
| A/B test results from recent changes | Identify impact of product changes | High | Experimentation Platform |
| Retention and engagement metrics | Understand if user engagement patterns are changing | Medium | User Analytics |
I'd prioritize understanding the transfer size distribution and frequency first, as these directly relate to our observed metric changes. Next, I'd examine user acquisition and segmentation to determine if our user mix is changing. Finally, I'd look at feature adoption to see if product changes are driving the behavior shift.
Step 6
Hypothesis Formation
 Based on the information available, here are my primary hypotheses:
1. New User Segment Hypothesis
- Hypothesis: We've acquired a significant number of new users who typically make smaller, more frequent transfers than our existing user base.
- Evidence Points:
- Stable total volume despite decreasing average
- Potential marketing campaigns targeting new demographics
- Possible product changes making the platform more accessible
- Impact Assessment: High - would explain both metrics simultaneously
- Validation Approach: Compare transfer patterns between new and existing users; analyze user growth rates and acquisition channels
2. Feature Adoption Hypothesis
- Hypothesis: Recent product features (like bill splitting, recurring payments, or small transfer incentives) have encouraged users to make more frequent, smaller transfers.
- Evidence Points:
- Product roadmap items launched in past 3-6 months
- Feature adoption metrics showing increased usage
- Changes in UI/UX that might emphasize certain transfer types
- Impact Assessment: High - product changes often drive behavior changes
- Validation Approach: Analyze feature adoption rates and correlate with transfer behavior; examine before/after behavior for users who adopt specific features
3. Use Case Evolution Hypothesis
- Hypothesis: Users are finding new use cases for our product, shifting from occasional large transfers to frequent small transfers (e.g., splitting restaurant bills vs. paying rent).
- Evidence Points:
- Changes in transfer descriptions or categories
- Shifts in transfer timing (weekday vs. weekend, time of day)
- Changes in recipient patterns (more unique recipients)
- Impact Assessment: Medium - natural evolution of product usage
- Validation Approach: Analyze transfer purposes, timing patterns, and recipient diversity
4. Competitive Response Hypothesis
- Hypothesis: Competitors have changed their fee structure or limits for large transfers, causing users to optimize their transfer behavior.
- Evidence Points:
- Competitor announcements or pricing changes
- User feedback mentioning competitors
- Changes in behavior near fee thresholds
- Impact Assessment: Medium - depends on competitive landscape
- Validation Approach: Analyze transfer amounts relative to fee thresholds; conduct competitive analysis; review user feedback
Step 7
Root Cause Analysis
Let's apply the "5 Whys" technique to our most promising hypotheses:
New User Segment Hypothesis:
- Why has the average transfer amount decreased? Because there are more small transfers in the mix.
- Why are there more small transfers? Because we have more users making small transfers.
- Why do we have more users making small transfers? Because we've acquired a new segment of users.
- Why have we acquired a new segment? Possibly due to new marketing channels or product features appealing to different demographics.
- Why are these new channels/features attracting different users? They may be targeting use cases that naturally involve smaller transfers (e.g., splitting bills vs. paying rent).
Feature Adoption Hypothesis:
- Why has the average transfer amount decreased? Because users are making more small transfers.
- Why are users making more small transfers? Because new features make small transfers more convenient or valuable.
- Why do these features encourage small transfers? They may solve specific problems that involve smaller amounts (like splitting a dinner bill).
- Why are these features being adopted now? Recent product launches, improved UX, or marketing pushes.
- Why did we develop these features? To expand use cases and increase engagement frequency.
Use Case Evolution Hypothesis:
- Why has the average transfer amount decreased? Because users are using the product for different purposes.
- Why are users finding new purposes? Because they're discovering the convenience of digital transfers for everyday expenses.
- Why are they discovering this now? Increased comfort with digital payments and broader acceptance.
- Why is this leading to smaller transfers? Everyday expenses tend to be smaller than periodic large payments.
- Why is this happening across our user base? Cultural shift in how people manage and split expenses.
Based on this analysis, the New User Segment and Feature Adoption hypotheses seem most plausible and directly connected to our metrics. They both explain how we could see more transfers of smaller amounts while maintaining the same total volume. The correlation between potential product changes and the timing of the metric shift makes the Feature Adoption hypothesis particularly compelling.
Step 8
Validation and Next Steps
To validate our hypotheses and determine the true root cause, I propose the following validation methods:
| Hypothesis | Validation Method | Success Criteria | Timeline |
|---|---|---|---|
| New User Segment | Cohort analysis comparing transfer patterns of new vs. existing users | Clear difference in average transfer size between cohorts | 1-2 days |
| Feature Adoption | Feature usage analysis correlating adoption with transfer behavior changes | Strong correlation between feature adoption and decreased transfer size | 2-3 days |
| Use Case Evolution | Transfer purpose analysis and user interviews | Identifiable shift in stated transfer purposes | 1 week |
| Competitive Response | Market analysis and user surveys about competitor usage | Evidence of users optimizing around fee structures | 1 week |
Immediate actions I would take:
-
Data Analysis:
- Segment users by acquisition date and compare transfer patterns
- Analyze feature adoption rates and correlate with transfer behavior
- Review transfer descriptions/categories for insights into purposes
-
User Research:
- Conduct quick surveys asking about transfer behavior changes
- Interview a sample of users who've shifted to smaller, more frequent transfers
- Review support tickets and feedback for relevant insights
-
Product Analysis:
- Review recent product changes that might influence transfer behavior
- Analyze A/B test results from relevant feature launches
- Examine user flows to identify friction points for different transfer sizes
For monitoring success, I would track:
- Average transfer amount by user cohort
- Transfer frequency per user
- Feature adoption rates
- User satisfaction metrics
- Revenue impact (if applicable)
Step 9
Decision Framework
Based on our validation results, here's a decision framework for addressing the root cause:
| Validation Outcome | Primary Action | Secondary Action |
|---|---|---|
| New user segment is driving change | Optimize onboarding for new segments; consider segment-specific features | Review pricing strategy to ensure profitability across all transfer sizes |
| Feature adoption is driving change | Double down on successful features; improve UX for these use cases | Develop complementary features to enhance the ecosystem |
| Use case evolution is occurring | Create dedicated flows for emerging use cases | Educate users about optimal ways to use the product for different needs |
| Competitive pressure is the cause | Evaluate fee structure and competitive positioning | Enhance value proposition beyond just transfer costs |
| Multiple factors confirmed | Prioritize actions based on revenue impact and strategic alignment | Develop a comprehensive roadmap addressing all validated factors |
If we confirm that new features like bill splitting are driving the change, we should:
- Optimize these features further
- Consider bundling related features
- Adjust our metrics to account for this new usage pattern
- Potentially revise our revenue model if needed
If new user segments are driving the change, we should:
- Refine our acquisition strategy to lean into these segments
- Develop features specifically for their use cases
- Consider how to increase their lifetime value
- Monitor retention closely to ensure sustainable growth
Step 10
Resolution Plan
Immediate Actions (24-48 hours)
- Complete urgent data analysis to confirm primary hypothesis
- Brief key stakeholders on findings and initial assessment
- Implement enhanced monitoring of transfer patterns
- Review any recent product changes that might be contributing
- Ensure customer support is aware of the investigation
Short-term Solutions (1-2 weeks)
- Adjust product analytics to better track transfer purposes and patterns
- Optimize user experience for the dominant use case (whether large or small transfers)
- Update financial forecasts if the shift appears permanent
- Conduct targeted user research to understand motivation behind behavior change
- Review pricing and fee structure to ensure alignment with new usage patterns
Long-term Prevention (1-3 months)
- Develop more granular metrics for monitoring transfer behavior
- Create an early warning system for unexpected metric shifts
- Implement regular cohort analysis to track behavior changes over time
- Review product strategy to ensure it accommodates diverse transfer needs
- Consider developing separate experiences optimized for different transfer types
- Evaluate revenue model to ensure sustainability with changing transfer patterns
This shift in transfer behavior, while initially concerning, may actually represent a positive evolution in how users interact with our product. More frequent engagement (through smaller transfers) could lead to higher retention and lifetime value if we adapt our product and business model appropriately.
.png)